

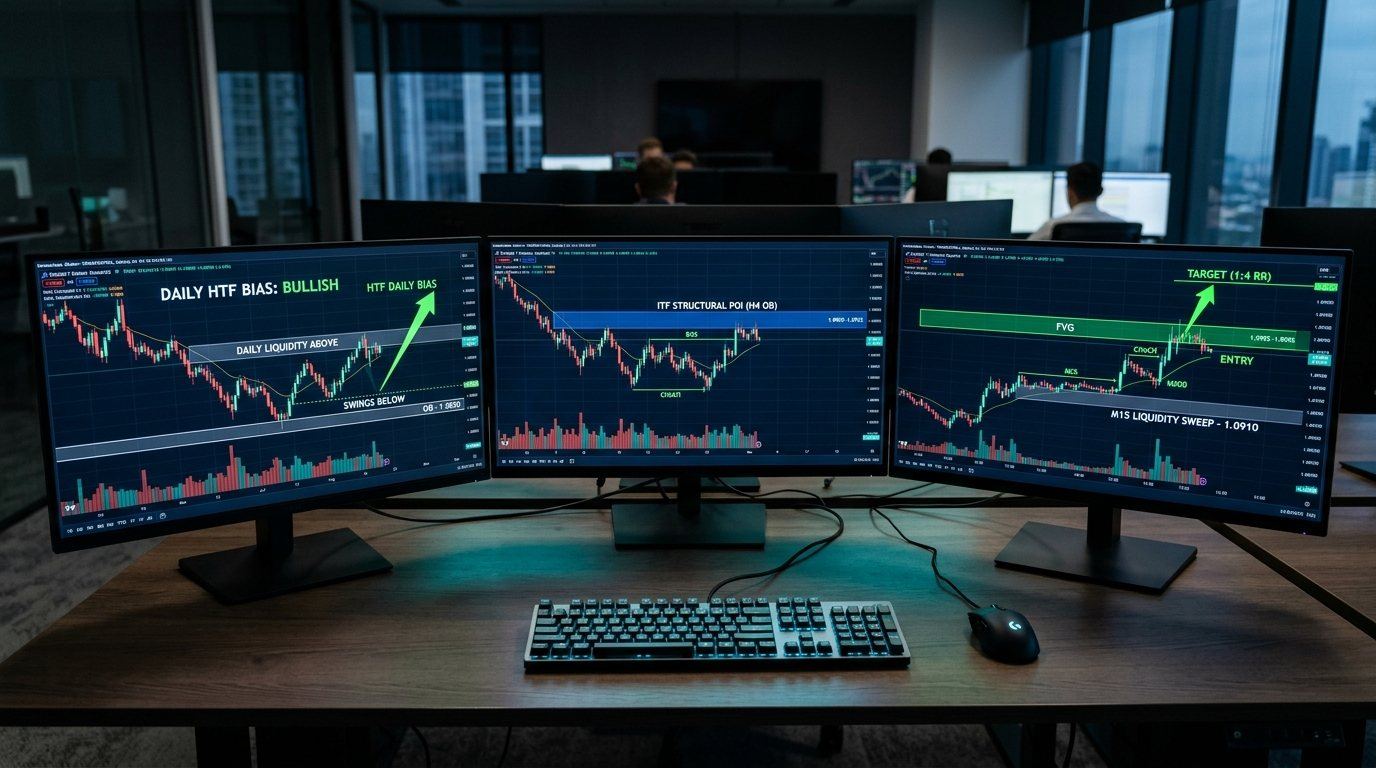
Die besten Zeiteinheiten für SMC Trading basieren auf einer 3-Stufen-Hierarchie (HTF-ITF-LTF) mit einem Skalierungsfaktor von 4x bis 6x. Für Daytrader ist die optimale Kombination 4-Stunden (HTF-Trend & Liquidität), 1-Stunde (ITF-Struktur & POI) und 5-Minuten / 15-Minuten (LTF-Einstieg via FVG & MSS). Für Scalper gilt 1-Stunde / 15-Minuten / 1-Minute, für Swing-Trader Wochenchart / Tageschart / 4-Stunden.
- 1. The Multi-Timeframe Triad: HTF, ITF, and LTF Architecture
- 2. The 3 Master Timeframe Combinations (Scalper, Day, Swing)
- 3. The Fractional Timeframe Rule (Factor of 4 to 6)
- 4. Why Bottom-Up Analysis Fails: The 1-Minute Noise Trap
- 5. Point of Interest (POI) Hierarchy Across Timeframes
- 6. Market Structure Shift (MSS) Confirmation Rules
- 7. Top-Down Execution Workflow Matrix
- 8. Real-World Multi-Timeframe Trade: EUR/USD & NQ Breakdown
- 9. Risk Governance & Prop Firm Drawdown Management
- 10. Frequently Asked Questions (PAA)
1. The Multi-Timeframe Triad: HTF, ITF, and LTF Architecture
In retail technical analysis, traders often flip frantically between arbitrary chart intervals—jumping from 2-minute to 10-minute to 30-minute charts without a coherent methodology. In institutional Smart Money Concepts (SMC), market analysis follows a strict scientific architecture called the Multi-Timeframe Triad.
Financial markets are fractal. Price delivery patterns repeat across every temporal scale because the underlying institutional algorithms operate on identical mathematical auction protocols. However, smaller timeframes are subject to localized liquidity sweeps, spread fluctuations, and noise. To filter this noise, professional desks divide their charting into three functional tiers:
| Tier | Timeframe Role | Institutional Function | Key Questions Answered |
|---|---|---|---|
| Tier 1: HTF | Higher Timeframe (The Compass) | Defines macroeconomic order flow, directional bias, and the primary Draw on Liquidity (DOL). | Where is price delivering on the weekly/daily chart? Are we expanding toward external buy-side or sell-side liquidity? |
| Tier 2: ITF | Intermediate Timeframe (The Bridge) | Identifies tradeable Points of Interest (POI), Order Blocks, Fair Value Gaps, and market structure shifts. | Where will price react? Which 4-Hour or 1-Hour imbalances are primed for institutional mitigation? |
| Tier 3: LTF | Lower Timeframe (The Trigger) | Provides precision trade entry, micro liquidity sweeps, and tight stop-loss placement. | Has price printed a 1m/5m Market Structure Shift and Fair Value Gap inside our higher-timeframe POI? |
The fundamental rule of the triad is simple: The Higher Timeframe always governs. When a 1-minute bullish setup forms inside a 4-Hour bearish order block, the 1-minute setup is not a buying opportunity—it is a retail trap engineered to provide liquidity for institutional sellers.
2. The 3 Master Timeframe Combinations (Scalper, Day, Swing)
Your ideal timeframe combination depends directly on your daily schedule, personality, and execution speed. At our proprietary trading desk at aFolks Digital, we standardize three distinct multi-timeframe matrices:
1. The Day Trader Combination (The Institutional Gold Standard)
- Higher Timeframe (HTF): Daily & 4-Hour (H4)
- Intermediate Timeframe (ITF): 1-Hour (H1) & 15-Minute (M15)
- Lower Timeframe (LTF): 5-Minute (M5)
This is the most balanced and sustainable combination for funded prop firm traders. The 4-Hour chart provides rock-solid directional bias, the 15-minute reveals institutional session liquidity pools, and the 5-minute provides clean entries with manageable slippage and spread buffers.
2. The Scalper Combination (High Frequency & Tight R:R)
- Higher Timeframe (HTF): 1-Hour (H1)
- Intermediate Timeframe (ITF): 15-Minute (M15)
- Lower Timeframe (LTF): 1-Minute (M1) / 30-Second
Ideal for traders operating within specific Killzone windows, such as the London Open or the New York session analyzed in our ICT London Silver Bullet Strategy Guide. Trades typically last 5 to 45 minutes, with stop losses ranging from 4 to 8 pips on forex majors and 8 to 15 ticks on index futures.
3. The Swing Trader Combination (Capital Compounding & Low Screen Time)
- Higher Timeframe (HTF): Weekly & Daily
- Intermediate Timeframe (ITF): 4-Hour (H4)
- Lower Timeframe (LTF): 1-Hour (H1)
Tailored for traders who manage full-time professional careers or oversee large portfolio allocations. Positions are held over several days or weeks, capturing multi-hundred-pip expansions while ignoring intraday noise.
3. The Fractional Timeframe Rule (Factor of 4 to 6)
Why do professional desks use specific intervals like 1D → 4H → 1H → 15m → 5m, instead of arbitrary intervals like 17-minute or 43-minute charts? The reason is the Fractional Timeframe Rule.
To maintain fractal integrity, each step down in your analysis should scale by a mathematical factor between 4 and 6:
Ideal Scaling Ratio: 4.0 ≤ Ratio ≤ 6.0
Notice how classical intervals conform to this golden ratio:
- Daily to 4-Hour: 24 hours / 4 hours = 6.0 (Perfect ratio)
- 4-Hour to 1-Hour: 4 hours / 1 hour = 4.0 (Perfect ratio)
- 1-Hour to 15-Minute: 60 minutes / 15 minutes = 4.0 (Perfect ratio)
- 15-Minute to 3-Minute / 5-Minute: 15 / 3 = 5.0 | 15 / 5 = 3.0 (Highly compliant)
- 5-Minute to 1-Minute: 5 minutes / 1 minute = 5.0 (Perfect ratio)
If you jump from a Daily chart directly to a 1-minute chart, your scaling ratio is 1,440:1! That massive temporal gulf blinds you to intermediate structural shifts, leading to catastrophic context disconnects. Adhering to the 4-to-6 scaling factor ensures that each candle on the child timeframe provides meaningful resolution to the parent candle's auction process.
Stop risking random dollar amounts when dropping down to smaller execution timeframes. Calculate exact lot sizing, pip risk distances, and profit buffers aligned with institutional standards:
Kostenlosen Positionsgrößen-Rechner öffnen →4. Why Bottom-Up Analysis Fails: The 1-Minute Noise Trap
The single most destructive mistake committed by novice SMC traders is Bottom-Up Analysis. This occurs when a trader sits down at their terminal, immediately opens a 1-minute chart, spots a Fair Value Gap or an Order Block, and takes an entry without consulting higher-timeframe structure.
Why is this practice financial suicide?
- Sub-Session Noise: A 1-minute chart records localized retail transactions, minor spread adjustments, and automated market-maker rebalancing. Over 70% of 1-minute order blocks fail because they lack institutional capitalization.
- Missing the Draw on Liquidity (DOL): If the Daily and 4-Hour charts are expanding toward a major sell-side liquidity pool at 1.0800, every 1-minute bullish order block printed on the way down is merely a temporary pause. The market will slice through it without hesitation.
- Over-Trading & Revenge Cycles: Watching 1-minute candles print every 60 seconds triggers dopamine spikes and impulsive trade execution. Traders rack up 10 to 15 trades in a single morning, violating their daily loss limits and prop firm drawdown buffers.
The Golden Execution Rule
The 1-minute timeframe is an execution trigger, never an analytical origin. You only open the 1-minute chart when price has arrived at a verified 4-Hour or 15-minute Point of Interest during a designated Killzone session.
5. Point of Interest (POI) Hierarchy Across Timeframes
In Smart Money Concepts, not all Points of Interest (POIs) carry equal weight. When multiple conflicting zones appear on your charts, you must prioritize them according to their institutional hierarchy:
| Hierarchy Rank | Timeframe Level | POI Type | Institutional Reliability | Recommended Action |
|---|---|---|---|---|
| Rank 1 (Supreme) | Weekly / Daily | External Liquidity Pools, Major Order Blocks | 90%+ Structural Impact | Defines directional bias; dictates long vs short posture. |
| Rank 2 (Structural) | 4-Hour (H4) | Unmitigated Fair Value Gaps, Breaker Blocks | 80%+ Reaction Probability | Primary target area for setting trading session alerts. |
| Rank 3 (Session) | 1-Hour / 15-Minute | Session Highs/Lows (Asian Range), Internal FVGs | 70%+ Execution Zone | Identifies session liquidity sweeps and Judas swing levels. |
| Rank 4 (Trigger) | 5-Minute / 1-Minute | Displacement FVG, Inversion FVG, Micro MSS | Entry Refinement Only | Used strictly to time entries and minimize stop-loss distance. |
When price approaches a Rank 1 or Rank 2 POI, you ignore all conflicting Rank 4 micro-structures. If a 1-minute bearish structure appears inside a Daily bullish order block, you wait for the 1-minute structure to shift bullish before entering long. For a deep structural breakdown of order blocks, review our foundational guide in Order Blocks vs Fair Value Gaps.
6. Market Structure Shift (MSS) Confirmation Rules
How do you know when a higher-timeframe POI has been confirmed on a lower timeframe? You must observe a clean Market Structure Shift (MSS).
A Market Structure Shift is the initial signal that institutional order flow has changed direction. The anatomy of a valid multi-timeframe MSS requires:
- Prior Liquidity Purge: Price must sweep a prominent swing high or low inside the HTF POI, raiding resting stop orders as explained in our Asian Range Liquidity Sweep Guide.
- Displacement Candle: Price must break the most recent lower-timeframe swing point with an aggressive, wide-range displacement candle with high relative volume.
- Candle Body Close: The displacement candle must close its real body cleanly beyond the swing level—wicks alone do not validate an MSS.
- Imbalance Creation: The displacement move must leave behind a clean Fair Value Gap or Inversion FVG, as detailed in our Inversion FVG Trading Guide.
7. Top-Down Execution Workflow Matrix
To systematize your morning preparation, execute this 4-step workflow prior to every trading session:
| Step | Timeframe | Operational Task | Checklist Verification |
|---|---|---|---|
| Step 1: Daily Bias | Daily (D1) | Examine the daily candle sequence; identify nearest Draw on Liquidity (DOL). | Is daily order flow bullish or bearish? Are we targeting equal highs or equal lows? |
| Step 2: Key Levels | 4-Hour (H4) | Mark key PD Arrays: 4H Order Blocks, Fair Value Gaps, and Breakers. | Set price alerts at the near boundary and 50% Consequent Encroachment line. |
| Step 3: Session Liquidity | 15-Minute (M15) | Mark the Asian Range High/Low and previous session extremes. | Wait for London or New York Open Killzone to raid session liquidity. |
| Step 4: Precision Entry | 5m / 1m | Wait for Market Structure Shift (MSS) and enter on FVG mitigation. | Place stop loss beyond swing extreme; target opposing HTF liquidity pool. |
8. Real-World Multi-Timeframe Trade: EUR/USD & NQ Breakdown
EUR/USD Intraday Alignment Case Study
- Step 1 (Daily Chart): EUR/USD was in a clear bullish trend following a sweep of weekly sell-side liquidity at 1.0780. Daily bias was unequivocally Bullish, targeting buy-side liquidity at 1.0950.
- Step 2 (4-Hour Chart): Price pulled back into a 4-Hour bullish Order Block at 1.0830. Sophia Sterling marked the 50% Consequent Encroachment of the overlapping 4H FVG at 1.0845.
- Step 3 (15-Minute Chart): During the Asian session, EUR/USD formed a 22-pip range between 1.0842 and 1.0864. At 03:15 EST (London Open), price executed a Judas swing down to 1.0832, tapping directly into the 4H Order Block.
- Step 4 (5-Minute & 1-Minute Chart): On the 1-minute chart, a violent displacement candle surged from 1.0834 to 1.0855, breaking 1m swing structure and printing an Inversion FVG.
- Execution & Result: Buy limit filled at 1.0844. Stop loss placed at 1.0828 (16 pips risk). Target set at the Daily buy-side liquidity target of 1.0920 (76 pips reward). The trade delivered a spectacular 1:4.75 Risk-to-Reward return within 3 hours.
9. Risk Governance & Prop Firm Drawdown Management
Multi-timeframe trading allows you to achieve tight stop-losses on small timeframes while targeting massive profit targets on higher timeframes. However, this power must be balanced by institutional risk governance:
- Maintain Constant 1% Capital Risk: Never risk more than 0.5% to 1.0% of your account balance per trade. Because lower-timeframe stop losses are tighter in pips, calculate your lot size with precision using our free risk calculator.
- Respect Trailing Drawdown Floors: For futures and prop firm traders, review our analysis in Trailing Drawdown vs Static Drawdown to avoid taking unnecessary risk when trailing buffers ratchet upward.
- Comply with Payout Consistency Caps: If your multi-timeframe trade yields an asymmetric windfall profit, verify your compliance ratio against the formulas detailed in Prop Firm Consistency Rule Calculation.
- Combine Multiple SMC Confluences: Enhance your multi-timeframe entries by layering Breaker Blocks with Fair Value Gaps using The Unicorn Setup Strategy.
To explore comprehensive mentorship masterclasses on multi-timeframe analysis, visit the aFolks Learning Platform, and access our full quantitative suite at aFolks Tools.