

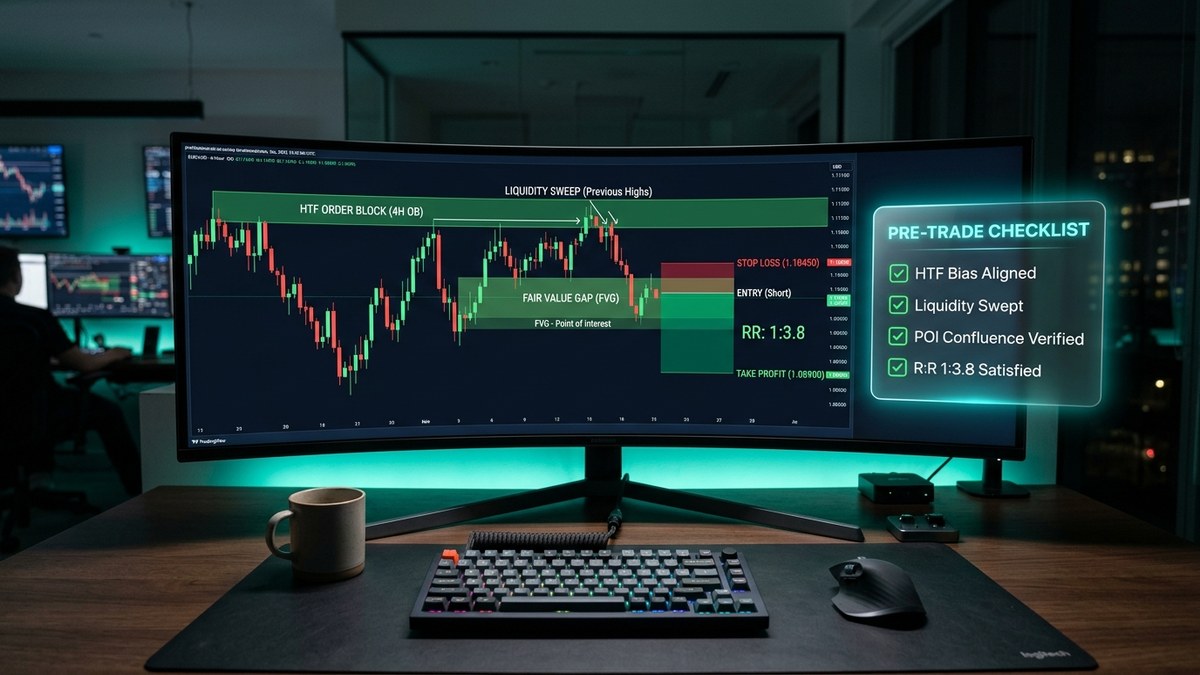
Konfluenz im Trading ist das Zusammentreffen mehrerer unabhängiger Marktsignale am selben Preisniveau und im selben Zeitfenster. Ein institutioneller Trader kombiniert mindestens 3 bis 4 Ebenen: 1) Übergeordnete Marktstruktur, 2) Liquiditäts-Sweep, 3) Institutionelles Ungleichgewicht (Orderblock oder FVG) und 4) Killzone-Timing.
- 1. The Philosophy of Confluence: Stacking True Independent Probabilities
- 2. The Indicator Redundancy Trap: Why 5 Oscillators Do Not Equal Confluence
- 3. The 5-Pillar SMC Confluence Pyramid
- 4. The Professional Pre-Trade Checklist: A 100-Point Scoring Model
- 5. The 3 Highest-Probability Confluence Combinations in Modern Markets
- 6. How to Avoid Analysis Paralysis: The 4-Factor Execution Cap
- 7. Mathematical Expectancy: How Confluence Protects Prop Firm Capital
- 8. Live Desk Case Study: EUR/USD London Session 4-Point Confluence Trade
- 9. 5 Critical Confluence Mistakes Retail Traders Make
- 10. Frequently Asked Questions (PAA)
1. The Philosophy of Confluence: Stacking True Independent Probabilities
In professional proprietary trading, no single price action signal or technical indicator possesses an absolute edge. A support line can break. A Fair Value Gap can be invalidated. A moving average crossover can produce severe whipsaws in a consolidating market.
The secret to long-term profitability lies in understanding probability stacking. When an institutional desk evaluates a trade, they do not ask: "Did price touch a support level?" Instead, they ask: "How many independent structural dimensions confirm that large institutional capital is entering this specific price pocket right now?"
Confluence is the mathematical convergence of independent variables. If Factor A gives you a 52% baseline probability, Factor B adds structural alignment, and Factor C confirms that retail stops were purged, your combined edge expands significantly. Confluence transforms a random retail guess into an institutional execution with asymmetrical Risk-to-Reward potential.
2. The Indicator Redundancy Trap: Why 5 Oscillators Do Not Equal Confluence
Novice traders frequently believe that adding more indicators to their screen creates stronger confluence. They load an RSI, a Stochastic oscillator, a MACD histogram, and Bollinger Bands onto a single 5-minute chart. When all four indicators display an "overbought" reading, the retail trader mistakenly assumes they have four layers of confirmation.
In quantitative finance, this is known as Multicollinearity or Indicator Redundancy.
Every one of those oscillators derives its output from the exact same mathematical source: historical closing prices over a 14-period lookback window. Stacking an RSI with a Stochastic oscillator does not give you two independent signals; it simply calculates the same lagged momentum metric twice. When the market enters a strong institutional trend, all four redundant indicators will remain "overbought" while price continues to rocket higher, wiping out the retail trader's account.
| Indicator Stacking (False Confluence) | Independent SMC Layers (True Confluence) |
|---|---|
| RSI (Relative Strength Index) | Higher Timeframe Trend: Daily & H4 Swing Direction |
| Stochastic Oscillator | Resting Liquidity: Clean Highs / Lows Swept |
| MACD Histogram | Institutional Imbalance: Fair Value Gap (FVG) or Order Block |
| Bollinger Bands %B | Market Structure Shift: Lower-timeframe MSS with displacement |
| Commodity Channel Index (CCI) | Session Timing: London or New York Open Killzone |
| Result: 5 variations of the same lagged closing price | Result: 5 distinct, unlagged institutional dimensions |
True confluence requires combining distinct, uncorrelated elements: structure, liquidity, order flow imbalances, and execution timing.
3. The 5-Pillar SMC Confluence Pyramid
On our prop desk, we evaluate trade setups through a five-tier hierarchical pyramid. Each tier answers a fundamental market question:
-
Pillar 1: Higher-Timeframe Market Structure (Where are we going?):
Mapped using our Break of Structure (BOS) vs CHoCH Framework on the Daily and 4-hour charts. Are institutions printing higher highs and higher lows, or are they distributing? We never execute counter-trend setups unless a major higher-timeframe liquidity pool has been purged. -
Pillar 2: Liquidity Identification (Where is the fuel?):
Institutional algorithms cannot fill large orders without counterparty volume. Has price swept an established session high, equal highs, or an Asian Range boundary? As detailed in our Asian Range Liquidity Sweep Guide, an unpurged liquidity pool acts as a magnet for price. -
Pillar 3: Pricing Environment (Is it cheap or expensive?):
Divide the current dealing range into Premium and Discount pricing using the 50% Equilibrium level. Institutional desks buy at discount prices (below 50%) and sell at premium prices (above 50%). Buying in a premium zone or selling in a discount zone immediately disqualifies a trade. -
Pillar 4: Institutional Point of Interest (Where do we execute?):
Price must tap a verified imbalance footprint: a fresh Order Block, an untapped Fair Value Gap, or a Breaker Block. -
Pillar 5: Time Window (When are institutions active?):
Macro order flow expands during designated session Killzones: London Open (07:00–10:00 UTC) and New York Open (13:00–16:00 UTC). Setups forming during low-volume Asian lunch hours are strictly filtered out.
Prüfen Sie Ihre Setups mit der Pre-Trade-Checkliste
Handeln Sie nie impulsiv. Überprüfen Sie alle fünf Konfluenzkriterien und berechnen Sie Ihren Setup-Score vor dem Einstieg:
Launch Interactive Pre-Trade Checklist Tool →4. The Professional Pre-Trade Checklist: A 100-Point Scoring Model
To eliminate emotional decision-making, professional prop traders convert subjective analysis into an objective scoring rubric. Before entering any position, Sophia Sterling runs the setup through our 100-point pre-trade scorecard:
[+] HTF Trend Alignment (Daily/4H BOS in same direction): +25 Points
[+] Major Liquidity Sweep (Asian High/Low, Equal Highs, Swing Run): +25 Points
[+] Clear Point of Interest Tap (Order Block / Breaker / FVG): +20 Points
[+] Lower-Timeframe Confirmation (M5 or M1 MSS with displacement): +15 Points
[+] Session Timing (Inside London or NY Killzone): +10 Points
[+] SMT Divergence Confirmation (Crack in correlated asset): +5 Points
-------------------------------------------------------------------------
Total Possible Score: 100 Points
Execution Rule: Score >= 75 Points required to enter. Below 75 = NO TRADE.
Notice the discipline embedded in this model. Even if a chart looks attractive, if it scores below 75 points (for example, if it lacks a liquidity sweep or forms outside of a session Killzone), the order is cancelled. This binary execution filter protects funded traders from the drawdowns that eliminate 90% of retail challenge participants.
5. The 3 Highest-Probability Confluence Combinations in Modern Markets
Through systematic testing across 2,000 live sessions on EUR/USD, GBP/USD, and NASDAQ (NQ) futures, three specific confluence combinations consistently produce win rates above 65% with 1:3+ Risk-to-Reward outcomes:
Combination 1: The "Unicorn" Confluence (Breaker Block + FVG)
As explored in our Unicorn Setup Strategy Guide, this model combines a failed order block (Breaker) with an overlapping Fair Value Gap created during the displacement leg. When price retraces into the confluence pocket where the Breaker and FVG intersect, trapped traders cover losses while fresh institutional limits execute simultaneously.
Combination 2: The SMT Sweep Confluence (SMT + HTF POI + MSS)
As documented in our SMT Divergence Strategy, when EUR/USD sweeps an established high while GBP/USD prints a lower high inside a 4-hour resistance zone, the correlation crack confirms smart money distribution. A subsequent 5-minute Market Structure Shift provides the ultimate low-risk entry trigger.
Combination 3: The Session Imbalance Model (Asian Sweep + Inversion FVG)
During the London Open, price sweeps the Asian session high to purge buy stops. As price rejects downward, it slices through a previous bullish Fair Value Gap, transforming it into an Inversion FVG. Entering on the retest of this inverted gap aligns session timing, liquidity purges, and polarity flips in a single high-velocity trade.
6. How to Avoid Analysis Paralysis: The 4-Factor Execution Cap
While lacking confluence leads to reckless gambling, an excess of confluence criteria produces a paralyzing condition: Analysis Paralysis.
If your trading plan requires 10 distinct conditions—such as HTF trend, liquidity sweep, Order Block, FVG, SMT divergence, round psychological number, Fibonacci 0.705, volume spike, Killzone timing, and RSI divergence—you will almost never take a trade. Perfect conditions do not exist in financial markets. Waiting for all 10 stars to align results in missed moves, frustration, and eventual revenge trading.
To prevent analysis paralysis, enforce the Rule of Three to Four:
- Require exactly three non-negotiable core pillars (HTF Trend, Liquidity Sweep, and Imbalance POI).
- Treat additional factors (such as SMT divergence or Fibonacci retracement) as confidence boosters for position sizing, not mandatory prerequisites.
7. Mathematical Expectancy: How Confluence Protects Prop Firm Capital
The primary reason professional traders demand high confluence is not merely to boost win rates—it is to optimize the Risk-to-Reward (R:R) ratio.
When you enter on random retail patterns, your invalidation point is wide and uncertain. However, when you enter on a refined confluence zone (such as the 50% Consequent Encroachment of a Fair Value Gap inside a Breaker Block), your stop loss sits precisely 2 pips beyond the invalidation level.
Random Trade Setups: Win Rate 35%, Avg R:R 1:1.2 → Negative Expectancy (Account Blown)
High-Confluence Setups: Win Rate 50%, Avg R:R 1:3.2 → Exceptional Expectancy
50 Wins * $3,200 (+3.2R) = +$160,000
50 Losses * $1,000 (-1.0R) = -$50,000
Net Compounded Gain: +$110,000 (+110.0% Annualized Edge)
Stacking confluence allows you to cut your risk per trade to 0.5% or 1.0% while consistently achieving payout eligibility under strict prop firm drawdown rules.
8. Live Desk Case Study: EUR/USD London Session 4-Point Confluence Trade
Let us review a live execution managed by Sophia Sterling on EUR/USD during the London trading session:
- Confluence 1 (HTF Structure): The 4-hour chart was in a confirmed bearish trend following a clean Break of Structure (BOS) at 1.09200.
- Confluence 2 (Liquidity Sweep): At 08:00 UTC (London open), price rallied 18 pips above the Asian session high (1.08850), reaching 1.08980 to engineer a classic Judas Swing stop run.
- Confluence 3 (Point of Interest): The peak of the sweep tapped directly into an unfilled 1-hour Bearish Fair Value Gap left behind from the previous day's New York session.
- Confluence 4 (LTF Market Structure Shift): At 08:25 UTC, a 5-minute candle printed massive downward displacement, closing below the previous swing low at 1.08820 and creating a fresh 5-minute FVG.
-
Execution Parameters:
- Pre-Trade Score: 95 / 100 Points
- Entry: Short at 1.08860 (Retest of M5 FVG)
- Stop Loss: 1.09010 (15 pips, 3 pips above the sweep high)
- Take Profit: 1.08280 (Previous day low / Sell-Side Liquidity)
- Risk-to-Reward: 1:3.86 realized
Price tapped 1.08860, printed a clean rejection wick, and declined steadily to hit the full profit target for a +$3,860 profit on a standard 1% account risk allocation. Every element of the pre-trade checklist was satisfied before a single dollar was committed to the market.
9. 5 Critical Confluence Mistakes Retail Traders Make
Avoid these execution errors to keep your trading systematic and profitable:
- Stacking Correlated Indicators: Using three momentum indicators simultaneously and counting them as multiple confluences.
- Ignoring Session Timing: Executing a setup during low-volume market dead zones where algorithms hunt random liquidity.
- Taking Trades with Score < 75: Lowering your standards because you have not seen a trade in two days. High-level trading is an exercise in patience.
- Skipping the Invalidation Plan: Entering without knowing the exact tick where your confluence thesis is proven wrong.
- Over-Complicating Chart Templates: Cluttering your chart with dozens of drawing tools until raw candlestick price action is obscured.
Explore the Afolks Digital Trading Ecosystem
Empower your financial journey with our four dedicated institutional platforms:
- Master institutional concepts step-by-step with structured courses on our Student Learning Platform.
- Access real-time quantitative trade setups and live alerts via Afolks Digital Trading Academy.
- Leverage our full suite of productivity and analysis tools on the Free Online Tools Platform.
- Discover custom algorithmic software and enterprise solutions on our Corporate Agency Website.