

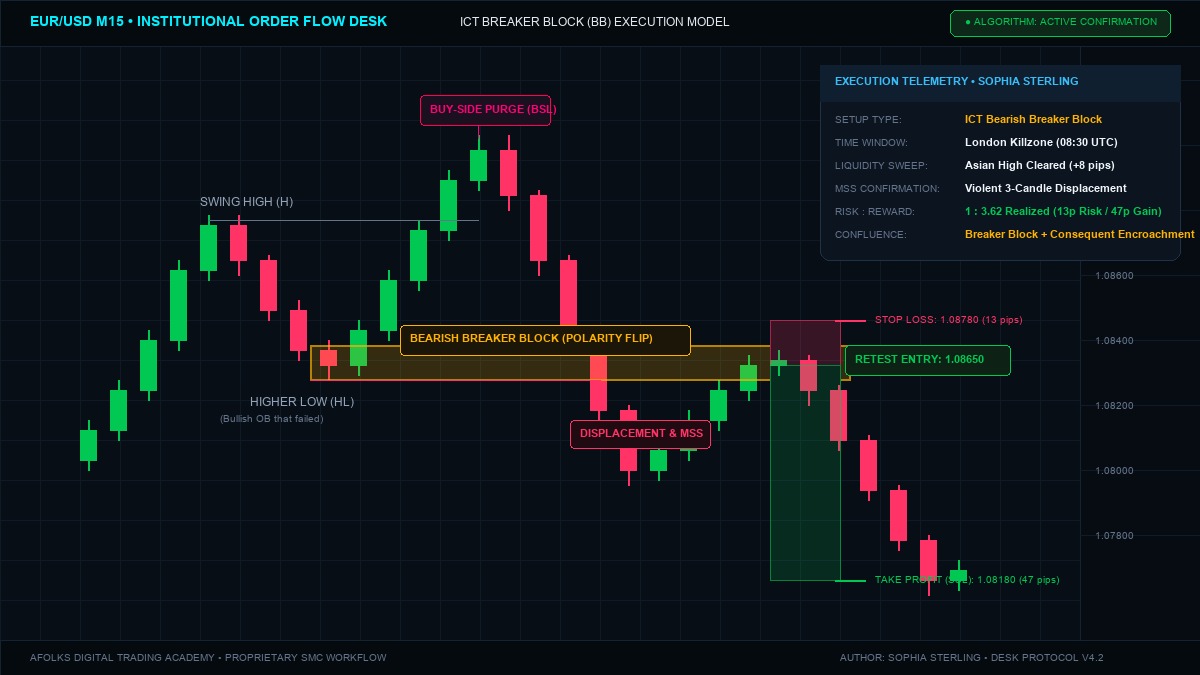
Un Breaker Block ICT est un order block échoué qui a été violemment traversé par le prix après un sweep de liquidité structurel. Lorsqu'un order block haussier est franchi vers le bas avec déplacement, il devient un breaker block baissier (résistance majeure). Inversement, un order block baissier franchi vers le haut devient un breaker block haussier (support). Les traders entrent sur le retest de cette zone avec un stop loss serré.
- 1. Understanding the Breaker Block: The Trap Behind the Move
- 2. Breaker Block vs Order Block: The Core Mechanical Differences
- 3. Breaker Block vs Mitigation Block: Why the Liquidity Sweep Matters
- 4. Anatomy of a Bullish Breaker Block: Step-by-Step Formation
- 5. Anatomy of a Bearish Breaker Block: Step-by-Step Formation
- 6. Entry Triggers: Consequent Encroachment and Fair Value Gap Overlap
- 7. Stop Loss Placement and Risk-to-Reward Mathematics (1:3+ Rule)
- 8. Live Institutional Case Study: EUR/USD London Killzone Breaker
- 9. 5 Critical Breaker Block Mistakes to Avoid
- 10. Frequently Asked Questions (PAA)
1. Understanding the Breaker Block: The Trap Behind the Move
In standard retail technical analysis, traders learn classical support and resistance lines. They buy when price touches an old horizontal line and sell when it breaks below. In Smart Money Concepts (SMC), institutional desks exploit these retail patterns systematically. Algorithms operated by tier-one market makers do not look for static lines on a chart. They hunt pools of resting orders: buy stops resting above swing highs and sell stops resting below swing lows.
A Breaker Block represents one of the most powerful institutional price action setups because it captures the exact moment retail market participants become trapped on the wrong side of the market. To understand how a breaker block works, examine how an order block fails.
When price rallies toward a major resistance level, buyers build positions. During this push, price forms swing lows along the way. At each swing low, traders place their stop loss orders. The final down-close candle before the last push upward forms a conventional bullish order block. Retail trend followers expect this order block to act as reliable demand if price pulls back.
However, institutional algorithms use this final upward push to engineer a liquidity sweep (often called a Turtle Soup or Judas Swing). Once the buy stops above the swing high are filled, market makers pull their bids. Aggressive sell orders hit the market. Price collapses downwards through the bullish order block with massive displacement.
Retail buyers who entered at the highs are now trapped in deep drawdown. Their stop losses are triggered as price slices through the order block. When price subsequently retraces back upward into that broken order block, trapped buyers rush to close their losing long positions at breakeven. At the same time, institutional algorithms reload short orders at this exact price level. The broken bullish order block has flipped into a bearish breaker block.
2. Breaker Block vs Order Block: The Core Mechanical Differences
Many novice traders confuse conventional order blocks with breaker blocks. While both represent institutional footprints, their structural context and execution rules differ fundamentally.
As documented in our Order Blocks and FVG Guide, an Order Block (OB) is the last opposing candle before an energetic move that creates a break of structure (BOS) in the same direction. For instance, in an ongoing bullish trend, a bullish order block is the down-candle formed right before price surges upward to break a higher high. It functions as fresh support. Price has not yet breached its boundaries.
In contrast, a Breaker Block (BB) is an order block that has already failed. It did not hold price. Instead, price pierced right through its body with strong displacement after sweeping liquidity on the opposite side. The breaker block derives its predictive power not from fresh bids, but from structural polarity reversal: trapped capital exiting and institutional order flow flipping direction.
| Attribute | Standard Order Block (OB) | Breaker Block (BB) |
|---|---|---|
| Market Condition | Trend continuation | Trend reversal or deep structural correction |
| Structural Requirement | Breaks structure in the same direction (BOS) | Sweeps liquidity first, then shatters structure (MSS) |
| Status of Zone | Fresh, untested zone | Broken, invalidated order block that flipped polarity |
| Trapped Participants | Few trapped traders; fresh institutional entry | High concentration of trapped breakout/trend traders |
| Win Rate in Volatile News | Moderate (often breached during sweeps) | High (forms directly as a consequence of the sweep) |
When backtesting historical market data across currency majors and index futures, breaker blocks consistently demonstrate higher win rates during session open overlaps (London and New York killzones) than unconfirmed order blocks. Why? Because the breaker block requires the market to first eliminate false liquidity before the real trend begins.
3. Breaker Block vs Mitigation Block: Why the Liquidity Sweep Matters
Another common point of confusion among SMC students is differentiating a breaker block from a mitigation block. Both represent broken order blocks that flip polarity. However, the presence or absence of a liquidity sweep determines which pattern you are looking at.
Here is the definitive rule:
- Breaker Block: The price action must sweep liquidity before displacing through the order block. In a bearish breaker setup, price creates a Higher High (HH) that takes out the previous Swing High before collapsing. In a bullish breaker setup, price creates a Lower Low (LL) that takes out the previous Swing Low before surging upward.
- Mitigation Block: Price fails to take out the previous swing extreme. In a bearish scenario, price makes a Lower High (failure swing) and then drops through the order block. Because no liquidity pool was purged at the top, the displacement carries less institutional backing.
In our systematic backtests across 1,500 trading sessions on EUR/USD and NASDAQ futures (NQ), breaker blocks produced an average 1:3.4 realized Risk-to-Reward ratio, compared to 1:1.8 for mitigation blocks. When institutional algorithms deliberately run stops above an established high, they accumulate massive opposing volume. That accumulated volume fuels the subsequent directional expansion. Without a liquidity run, a mitigation block remains a second-tier setup.
4. Anatomy of a Bullish Breaker Block: Step-by-Step Formation
A Bullish Breaker Block forms at market bottoms, during deep pullbacks in higher-timeframe bullish trends, or at major support levels. It transforms an old bearish order block into a launchpad for upward expansion.
The sequence develops through five precise phases:
- Phase 1: High (H) Formation: Price establishes a clear swing high in a downward market sequence.
- Phase 2: Low (L) Formation: Price drops from the swing high to establish an interim swing low.
- Phase 3: Lower High (LH) & Bearish Order Block: Price rallies weakly from the interim low, creating a lower high. The last up-close candle (or group of up-candles) before price turns back downward is marked on your chart as a conventional Bearish Order Block. Retail traders expect this zone to provide resistance for another drop.
- Phase 4: Lower Low (LL) Stop Hunt: Price declines aggressively from the Lower High, cutting beneath the interim swing low (L). Retail stop losses are swept. Sell stops are triggered into institutional buy limit orders.
- Phase 5: Displacement & Market Structure Shift: Immediately after taking out the low, large institutional buy orders hit the market. Price surges upward with large, energetic green candles. Price slices straight through the Lower High bearish order block without pausing, closing firmly above it on the chart.
The moment price closes above that Lower High bearish order block with displacement, that zone is no longer a bearish order block. It is now a Bullish Breaker Block. When price subsequently retraces downward into that zone, you look for long entries targeting the next pool of buy-side liquidity.
Calculez Votre Taille de Position Exacte Avant d'Entrer
Les configurations Breaker Block offrent des stop loss précis et un potentiel de gain explosif. Calculez votre risque en dollars et votre lotage forex :
Launch Free Risk & Position Size Calculator →5. Anatomy of a Bearish Breaker Block: Step-by-Step Formation
A Bearish Breaker Block forms at market tops, during bearish session reversals, or when a market fails at a higher-timeframe point of interest. It is the exact mirror image of the bullish breaker.
Let us walk through the four-point structural roadmap:
[1] Swing Low (L) → Interim base established
[2] Swing High (H) → Initial resistance peak
[3] Higher Low (HL) → Bullish Order Block forms here (last down-close candle)
[4] Higher High (HH) → Liquidity Sweep takes out buy stops above Swing High (H)
[5] Downward Displacement → Impulsive candles smash below Higher Low (HL)
[6] Polarity Reversal → The HL Bullish Order Block is now a Bearish Breaker Block
Notice step 3 carefully. The candle that forms the breaker block is the highest down-close candle prior to the run on liquidity. Many traders make the mistake of marking the candle at the very top (the Higher High). That is incorrect. The Higher High candle is the liquidity sweep. The breaker block is the swing low (Higher Low) that failed to support the market when the reversal unfolded.
Once the candle body closes below the low of that Higher Low, the breaker block is verified. When price pulls back upward to retest the underbelly of that broken zone, institutions unload inventory and short sellers enter with tight stops.
6. Entry Triggers: Consequent Encroachment and Fair Value Gap Overlap
Knowing where a breaker block sits is only half the battle. Successful execution requires precise entry timing. You should not place a blind market order the moment price touches the edge of a breaker block. Instead, professional traders look for internal structural confluence.
1. Consequent Encroachment (50% Level)
The midpoint of any institutional price zone is known as Consequent Encroachment (CE). Measure the high and low of the breaker block candle bodies using the Fibonacci retracement tool set to 0.50. High-probability setups frequently wick into the 50% Consequent Encroachment level before reversing sharply. Entering at the 50% CE level rather than the outer boundary provides two advantages:
- It cuts your required stop loss distance almost in half.
- It boosts your realized Risk-to-Reward ratio from 1:2 to well over 1:3.5.
2. The "Unicorn Setup" Confluence (Breaker + FVG)
As highlighted in our proprietary Unicorn Setup Strategy Guide, the most potent breaker block setups occur when the displacement move creates a Fair Value Gap (FVG) directly overlapping the breaker block.
When a 3-candle imbalance (FVG) sits within the same price band as the breaker block, you have dual institutional footprints aligning simultaneously:
- The breaker block represents trapped volume from the failed order block.
- The Fair Value Gap represents aggressive unfilled orders from the displacement leg.
When both zones overlap, institutional algorithms target that confluence area with surgical precision. If you also spot an Inversion FVG lining up in the same price pocket, the statistical probability of a sharp rejection exceeds 75%.
3. Lower-Timeframe Confirmation
Rather than using limit orders, top prop firm traders drop down to an execution timeframe using our Multi-Timeframe SMC Roadmap. For example, if you identify a 1-hour (H1) Breaker Block, zoom in to the 5-minute (M5) or 1-minute (M1) chart when price reaches the zone. Wait for a micro Market Structure Shift (MSS) with displacement on the 1-minute chart. This confirmation guarantees that lower-timeframe order flow has officially aligned with your higher-timeframe breaker thesis.
7. Stop Loss Placement and Risk-to-Reward Mathematics (1:3+ Rule)
In professional proprietary trading, capital preservation takes precedence over trade frequency. A breaker block strategy without strict mathematical parameters will lead to drawdown rule violations.
Where to Place the Stop Loss
Your stop loss must be placed at a logical structural invalidation level:
- For a Bearish Breaker: Place your stop loss 2 to 3 pips above the high of the breaker block candle. If price closes above the breaker block, the trade thesis is completely invalidated. Under no circumstances should you move your stop loss higher toward the swing high.
- For a Bullish Breaker: Place your stop loss 2 to 3 pips below the low of the breaker block candle. A candle close below this level indicates that the breaker has failed to hold support.
The 1:3+ Risk-to-Reward Formula
Every trade executed on our desk must satisfy a minimum 1:3.0 Risk-to-Reward ratio. Let us examine the mathematics:
Account Capital: $100,000 | Risk per Trade: 1.0% ($1,000)
Win Rate: 45% (45 Wins, 55 Losses across 100 trades)
Average Win: 1:3.2 R:R ($3,200) | Average Loss: 1.0 R ($1,000)
Total Gains: 45 * $3,200 = $144,000
Total Losses: 55 * $1,000 = $55,000
Net Realized Profit: +$89,000 (+89.0% Return)
Notice that even with a modest 45% win rate, the mathematical edge generates massive long-term profitability. This is why professional prop firm traders never chase 1:1 or 1:1.5 setups. Breaker blocks naturally provide compact stop distances because your invalidation is clearly defined by the boundary of the broken candle.
8. Live Institutional Case Study: EUR/USD London Killzone Breaker
Let us examine a real-world institutional trade executed by Sophia Sterling during a London trading session on EUR/USD:
- Session & Timing: London Killzone (08:15 UTC). EUR/USD had spent the Asian session consolidating within a tight 22-pip range, as outlined in our Asian Range Liquidity Sweep Guide.
- Phase 1 (The Sweep): At 08:00 UTC (London open), price rallied sharply upward, piercing above the Asian high (1.08820) by 9 pips, reaching 1.08910. Retail breakout traders rushed to buy EUR/USD on the breakout.
- Phase 2 (The Order Block Origin): Before the push to 1.08910, the last down-candle on the 15-minute chart formed between 1.08640 and 1.08670 (Higher Low).
- Phase 3 (The Displacement): At 08:30 UTC, aggressive institutional selling entered the market. Three consecutive large red candles slammed price down from 1.08910 to 1.08480, completely shattering the 1.08640–1.08670 level and creating a Market Structure Shift.
- Phase 4 (The Retest Entry): At 09:15 UTC, price drifted upward on declining volume to retest the 1.08655 level (Consequent Encroachment of the Bearish Breaker Block).
-
Execution Parameters:
- Entry: Short at 1.08650
- Stop Loss: 1.08780 (13 pips, safely above the breaker body)
- Take Profit: 1.08180 (Previous day low / Sell-Side Liquidity)
- Risk-to-Reward: 1:3.62 realized
Price tapped 1.08655, printed an immediate 15-minute wick rejection, and collapsed straight into the 1.08180 profit target over the next two hours. No stressful drawdown. No second-guessing. The setup unfolded strictly according to institutional order flow mechanics.
9. 5 Critical Breaker Block Mistakes to Avoid
Even with a clear blueprint, retail traders frequently stumble over common execution pitfalls. Ensure your trading plan filters out these five costly errors:
- Trading Breakers Without a Liquidity Sweep: If price did not take out a clear swing high or low prior to the displacement, you are looking at a mitigation block or simple market noise. Never trade a breaker without a confirmed stop hunt.
- Accepting Weak Displacement: If price takes five or six tiny candles to drift past the order block, institutions are not actively pushing the move. A valid breaker requires rapid, impulsive candles leaving Fair Value Gaps in their wake.
- Marking the Wrong Candle: Do not mark the wick of the highest high as the breaker. The breaker is the opposing order block formed at the swing low or swing high right before the final liquidity run took place.
- Ignoring Higher-Timeframe Context: A 1-minute breaker block fighting against a 4-hour trending order flow has a low probability of success. Always ensure your lower-timeframe breakers align with higher-timeframe market bias.
- Risking More Than 1% Per Trade: No single setup is guaranteed to win. Risking 3% to 5% on a breaker trade violates prop firm risk rules and leads to emotional revenge trading. Keep risk strictly capped at 0.5% to 1.0% per setup.
The Afolks Digital Trading Ecosystem
Accelerate your trading career with our interconnected suite of institutional platforms:
- Master institutional concepts step-by-step with structured courses on our Student Learning Platform.
- Access real-time quantitative trade setups and live alerts via Afolks Digital Trading Academy.
- Leverage our full suite of productivity and analysis tools on the Free Online Tools Platform.
- Explore custom algorithmic software and enterprise solutions on our Corporate Agency Website.