

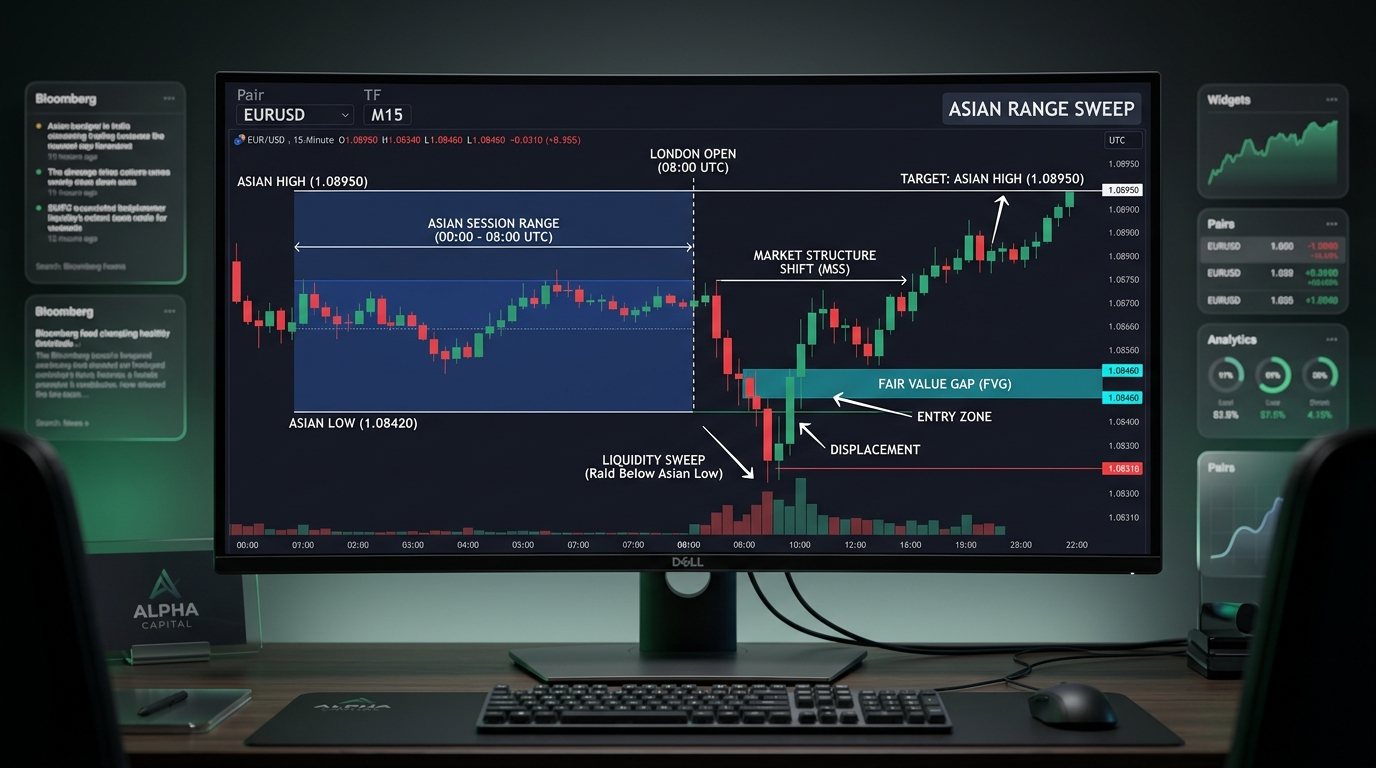
Asya seansı likidite temizliği stratejisi, Power of Three (AMD) döngüsüne dayanan bir Smart Money Concepts modelidir. Asya seansının (20:00 - 00:00 EST) en yüksek ve en düşük seviyeleri belirlenir. Londra açılışında gerçekleşen Judas Swing manipülasyonu sonrasında Piyasa Yapısı Kırılımı (MSS) ile ters yönde pozisyon alınır.
- 1. The Foundation: ICT Power of Three (AMD Cycle)
- 2. Precise Session Time Windows & Timezone Alignment
- 3. The 15 to 30 Pip Range Width Filter
- 4. Anatomy of the Judas Swing: Identifying Fake Breakouts
- 5. Step-by-Step Execution Framework: Sweep to Target
- 6. TradingView Pine Script Indicator Code
- 7. Real-World Execution: EUR/USD & GBP/USD Case Studies
- 8. Model Comparison: Asian Sweep vs Silver Bullet vs Unicorn
- 9. Risk Parameters & Prop Firm Drawdown Preservation
- 10. Frequently Asked Questions (PAA)
1. The Foundation: ICT Power of Three (AMD Cycle)
To execute the Asian range liquidity sweep with precision, you must understand why the market behaves in predictable rhythmic cycles. Financial markets do not move randomly. Interbank price algorithms, notably the Electronic Spot Price Auction Engine and institutional market-making programs, operate on a three-phase daily template known in Inner Circle Trader (ICT) methodology as the Power of Three or AMD Cycle.
The AMD cycle consists of:
- Accumulation: During the Asian session, lower liquidity and thinner trading volumes produce horizontal consolidation. Market makers use this period to quietly build positions while retail participants set buy-stop orders above the consolidation high and sell-stop orders below the consolidation low.
- Manipulation (The Judas Swing): As the European financial centers open in Frankfurt and London, institutional algorithms drive price aggressively through one side of the Asian range. This sudden surge triggers retail breakout traders into entering the wrong direction while sweeping the stop losses of existing counter-trend positions.
- Distribution: Having collected immense liquidity from retail stop orders, institutions reverse price and drive the genuine expansion of the daily candle toward higher-timeframe order flow objectives.
Institutional Core Principle
Liquidity is the oxygen of institutional order flow. Large commercial banks cannot execute thousand-lot orders without substantial liquidity pools. The high and low of the Asian session serve as engineered pools of buy-side and sell-side stops designed specifically to fill institutional books.
When you understand this architectural flow, you stop trading the initial London breakout. Instead, you wait patiently like an apex predator for the stop run to complete, preparing your entry in direct harmony with the true institutional direction.
2. Precise Session Time Windows & Timezone Alignment
Timing is the primary variable that separates winning Smart Money setups from costly mistakes. If you mark your session highs and lows using the wrong timezone, your liquidity reference levels will fail.
All algorithmic session models reference New York Local Time (EST/EDT). The table below outlines the exact chronological windows required for the Asian Range Liquidity Sweep:
| Phase | New York Time (EST) | UTC Time | Institutional Function |
|---|---|---|---|
| Asian Range (Accumulation) | 20:00 – 00:00 EST | 01:00 – 05:00 UTC | Establishes the initial consolidation boundary; records Asian High and Asian Low. |
| Asian Extended Buffer | 00:00 – 02:00 EST | 05:00 – 07:00 UTC | Pre-Frankfurt session holding pattern; watches for early liquidity probes. |
| Frankfurt / London Open | 02:00 – 05:00 EST | 07:00 – 10:00 UTC | The Execution Window: Judas swing sweeps Asian boundary, produces MSS, and triggers entry. |
| London Expansion | 05:00 – 08:00 EST | 10:00 – 13:00 UTC | Distribution phase; price drives toward the opposite Asian boundary and higher-timeframe targets. |
| New York Overlap | 08:00 – 11:00 EST | 13:00 – 16:00 UTC | Secondary execution window; can offer continuation or secondary liquidity retests. |
You must configure your charting platform (TradingView) to UTC-4 (New York Time). The absolute reference boundaries are the highest wick and lowest wick printed strictly between 20:00 EST and midnight (00:00 EST).
3. The 15 to 30 Pip Range Width Filter
Not every Asian range offers a tradable liquidity sweep. One of the most common mistakes amateur traders make is treating every session identically. At our institutional trading desk, we apply a strict mathematical filter: the 15 to 30 pip range rule.
The distance between the Asian High and the Asian Low on major currency pairs like EUR/USD and GBP/USD must fall inside a specific volatility channel:
Ideal Channel: 15.0 Pips ≤ Range Width ≤ 30.0 Pips
Why does this width filter dictate trade viability?
- Ranges under 12 Pips (Too Compressed): When the Asian range is excessively tight, it indicates extreme illiquidity or impending holiday bank closures. The stop-loss pools above and below the range are minuscule, meaning institutions will often bypass them entirely or blow through both boundaries in erratic chop.
- Ranges between 15 and 30 Pips (The Sweet Spot): This consolidation provides adequate time for retail stops to accumulate on both sides without extending daily average true range (ATR) limits. When the Judas swing raids this boundary, the potential reward back to the opposite side delivers a clean 1:3 to 1:4 Risk-to-Reward ratio.
- Ranges over 35 to 40 Pips (Too Wide / Already Trending): If the Asian session covers 40 or more pips, the market was already active overnight due to Asian geopolitical news or central bank statements. The session was not an accumulation phase; it was already an expansion phase. Expecting a standard sweep and reversal in London under these conditions frequently leads to trend continuation losses.
Hızlı seans açılışlarında lot boyutunu şansa bırakmayın. Ücretsiz hesaplayıcımızla riskinizi anında optimize edin:
Ücretsiz Pozisyon Boyutu Hesaplayıcısını Aç →4. Anatomy of the Judas Swing: Identifying Fake Breakouts
The term Judas Swing refers to the deceptive initial move of the London session. Named after the biblical act of betrayal, this move appears strong, impulsive, and decisive—enticing breakout traders into entering market orders—only to betray them minutes later.
How do you distinguish a manipulative Judas swing from a genuine institutional breakout? Look for these three definitive characteristics:
1. Penetration Depth (The 5 to 20 Pip Liquidity Raid)
A classic Judas swing rarely travels more than 10 to 20 pips past the Asian range boundary. It pierces just deep enough to trigger resting buy-stop or sell-stop liquidity. If price runs 40 pips beyond the Asian high without deceleration, it is an aggressive trend day, not a sweep.
2. Candlestick Wick Rejection
On the 15-minute chart, the Judas swing candle frequently leaves a long, distinct wick protruding beyond the Asian level, with the candle body closing back inside the range. This visual signature signals that interbank dealers absorbed retail orders and rejected higher or lower prices.
3. Lower-Timeframe Market Structure Shift (MSS)
A liquidity sweep alone is never a signal to enter. You must drop down to the 1-minute or 5-minute chart and verify a structural shift. If price sweeps the Asian Low, you must see a violent upward displacement candle that closes cleanly above the most recent lower-timeframe swing high. This confirms that institutional buyers have stepped into the market.
5. Step-by-Step Execution Framework: Sweep to Target
To execute this strategy with consistent institutional discipline, follow this 5-step operational protocol every single morning:
| Step | Phase | Execution Trigger | Confirmation Required |
|---|---|---|---|
| Step 1 | Pre-Session Analysis | Determine Higher-Timeframe Daily Bias on 4H/Daily chart. | Confirm if daily order flow is bullish or bearish. |
| Step 2 | Mark Range Box | Draw horizontal rays at Asian High & Asian Low (20:00–00:00 EST). | Verify range width is between 15 and 30 pips. |
| Step 3 | Watch for Liquidity Raid | Wait for London Open (02:00–04:00 EST) Judas swing to purge Asian level. | Must pierce boundary and show exhaustion wicks. |
| Step 4 | Confirm Displacement | Drop to 1m or 5m chart; wait for Market Structure Shift (MSS). | Displacement candle must print a clear Fair Value Gap (FVG). |
| Step 5 | Limit Order Entry | Set buy/sell limit order at the FVG boundary (50% or CE level). | Stop loss placed 2–4 pips beyond the sweep swing extreme. |
Your profit targets follow a dual-exit structure:
- Take Profit 1 (Scale Out 50%): Asian session Equilibrium (50% midpoint of the Asian Range). Once reached, move your stop loss to break-even.
- Take Profit 2 (Final Runner): The opposing Asian session boundary (e.g., if you bought the Asian Low sweep, your final target is the Asian High). This provides the classic 1:3 to 1:4.5 R:R payout setup.
6. TradingView Pine Script Indicator Code
To automate the visualization of the Asian range and avoid manual drawing errors, our quantitative developers at aFolks Digital engineered this clean Pine Script v5 indicator. It automatically highlights the 20:00 to 00:00 NY session box, labels the Asian High and Low, and prints a visual sweep alert when price pierces either boundary:
Paste this script directly into your TradingView Pine Editor. It eliminates cognitive friction and gives you instant visual confirmation during the pre-London open briefing.
7. Real-World Execution: EUR/USD & GBP/USD Case Studies
Let us dissect an authentic market execution on EUR/USD:
- Market Context: Higher-timeframe daily bias on EUR/USD was strongly bullish following a weekly Order Block mitigation at 1.0820.
- Asian Range: From 20:00 to 00:00 EST, EUR/USD consolidated between Asian Low: 1.08420 and Asian High: 1.08950 (a 23-pip consolidation box, passing our range filter).
- The Sweep (03:15 EST): Frankfurt opened with mild selling, followed by an aggressive red London candle driving down to 1.08310. This swept the Asian Low by 11 pips, raiding retail sell-stop liquidity.
- The Confirmation (03:30 EST): On the 5-minute chart, an expansive green displacement candle erupted, surging from 1.08320 to 1.08580 and closing well above the previous lower high. This confirmed a clear Market Structure Shift (MSS) and printed a 6-pip Fair Value Gap between 1.08440 and 1.08500.
- Trade Execution: Sophia Sterling placed a buy limit order at 1.08460 (consequent encroachment of the FVG). Stop loss was set at 1.08280 (18 pips risk, placed below the Judas swing low with a 3-pip buffer).
- The Target: Take-profit target was placed at the Asian High: 1.08950 (49 pips reward).
- Trade Result: The limit filled at 03:42 EST. Price rallied straight into the European morning session, hitting the target at 06:15 EST for a clean +1:2.72 R:R return without suffering more than 4 pips of floating drawdown.
8. Model Comparison: Asian Sweep vs Silver Bullet vs Unicorn
Understanding how the Asian Range Liquidity Sweep integrates with our other core trading models allows you to select the optimal setup depending on current session conditions:
| Execution Model | Primary Time Window | Primary Entry Mechanism | Typical R:R | Ideal Market Regime |
|---|---|---|---|---|
| Asian Range Liquidity Sweep | 02:00 – 05:00 EST (London) | Liquidity sweep of session box + MSS + FVG | 1:2.5 to 1:4.5 | Consolidation to Expansion cycles |
| ICT London Silver Bullet | 03:00 – 04:00 EST strictly | Displacement Fair Value Gap fill in 1-hour window | 1:2.0 to 1:3.5 | Trending institutional London volume |
| The Unicorn Model | Any major killzone | Breaker Block overlapping with Fair Value Gap | 1:3.0 to 1:5.0 | Failed order blocks & structural shifts |
Notice that the Asian Range Liquidity Sweep provides the overarching directional roadmap for the entire London morning. Often, the entry within this strategy coincides directly with the 03:00 to 04:00 AM window analyzed in our ICT London Silver Bullet Strategy Guide.
9. Risk Parameters & Prop Firm Drawdown Preservation
Executing liquidity sweeps requires strict mathematical risk governance, especially for traders operating funded prop firm accounts. If you enter too early before structural confirmation, a genuine market breakout can push your account straight into daily drawdown violation.
Always follow these three risk rules:
- The 1% Maximum Risk Rule: Never risk more than 0.5% to 1.0% of your account balance on any single Asian sweep setup. If your stop distance is 15 pips, calculate your lot size so that reaching the stop loss costs exactly 1% of equity. Use our free risk calculator to automate this.
- Account for Trailing Drawdown Rules: If you trade accounts under strict drawdown calculations, review our institutional guide in Trailing Drawdown vs Static Drawdown to avoid taking unnecessary risk when trailing buffers lock beneath you.
- Respect Prop Firm Profit Caps: When harvesting large winning trades during London expansion, ensure your single-day profit does not trigger the consistency penalty outlined in Prop Firm Consistency Rule Calculation.
For broader structured educational masterclasses on liquidity sweeps, visit the aFolks Learning Platform, and explore our full algorithmic software stack at aFolks Tools.