

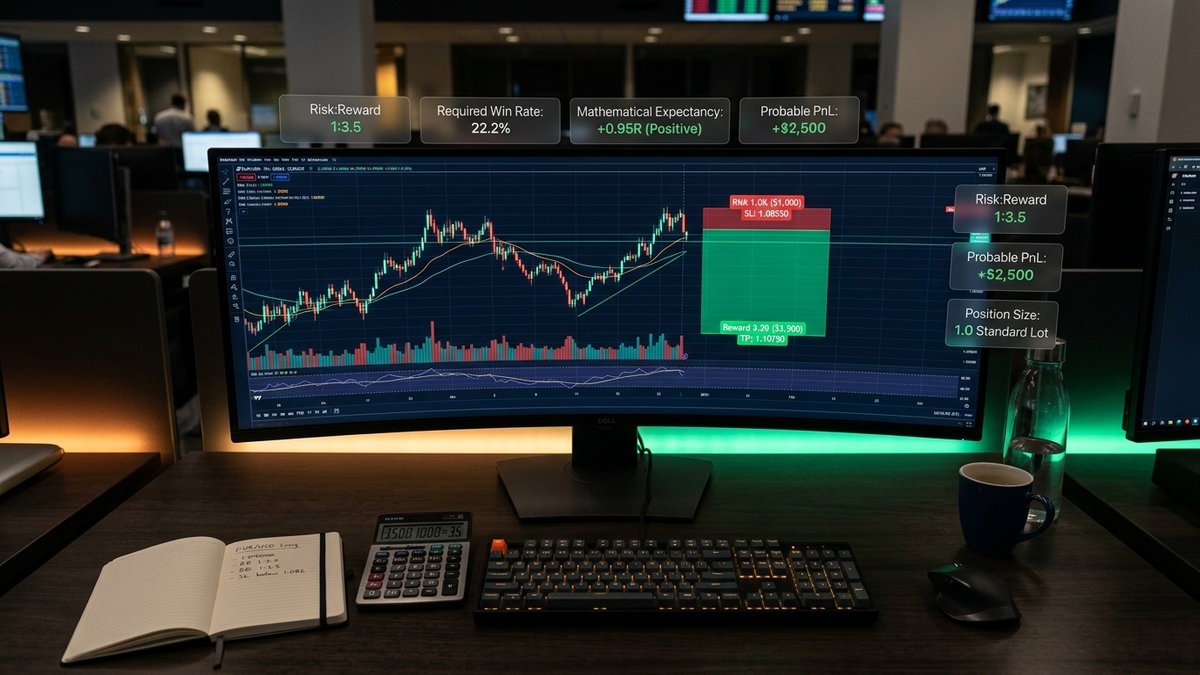
Ticarette risk ödül oranı (R:R), bir işlemde göze alınan potansiyel zararın hedeflenen kâra olan oranıdır. Kurumsal işlem masaları minimum 1:3 R:R oranını zorunlu tutar; çünkü bu oran başabaş kazanma oranı eşiğini tam olarak %25 seviyesine çeker. Asimetrik risk yönetimi pozitif matematiksel beklenti üretir ve kayıp serilerinde sermayenizi güvenceye alır.
- 1. Defining the Risk to Reward Ratio in Trading
- 2. Mathematical Expectancy: The True Engine of Trading Longevity
- 3. The Breakeven Win Rate Formula and Comparative Expectancy Table
- 4. Why 90% of Retail Traders Fail: The Inverted Risk Trap
- 5. Position Sizing: Turning Theoretical R:R into Concrete Dollar Risk
- 6. How Institutional Desks Engineer Asymmetric 1:3+ Trade Setups
- 7. Target Management: Fixed Multiples vs Trailing Runners
- 8. Live Case Study: Marcus Reid on Gold Futures (GC) 1:4.2 R:R Execution
- 9. Prop Firm Risk Protocol: Drawdown Buffers and Daily Loss Caps
- 10. The 5-Step R:R Pre-Trade Execution Checklist
- 11. Frequently Asked Questions (PAA)
1. Defining the Risk to Reward Ratio in Trading
In professional trading desks, capital allocation is an exercise in probability distribution rather than fortune-telling. The risk to reward ratio in trading (commonly abbreviated as R:R) stands as the foundational metric governing whether an account compounds or bleeds into liquidation. At its mechanical core, R:R defines the ratio between the capital you commit to lose if your setup fails (your stop loss) and the capital you capture when the market reaches your structural objective (your take profit).
If you enter a long position on Gold futures (GC) at \$2,650.00 with a stop loss placed at \$2,642.00 (risking \$8.00 per ounce, or 80 ticks) and assign a take profit target at \$2,674.00 (aiming for \$24.00 per ounce, or 240 ticks), your trade structure features a 1:3 risk to reward ratio. You are risking 1 unit of capital to extract 3 units of reward.
Retail marketing often seduces beginners with flashy advertisements promising 85% or 90% win rates. In real-world institutional execution, win rate is an incomplete metric. A trader winning 85% of their positions will still destroy their entire account if their average loss is 10 times larger than their average win. Conversely, systematic trend followers and Smart Money practitioners frequently operate at a modest 35% to 45% win rate while producing immense annual profits because their average winning trade delivers 3R to 5R gains while their losses remain firmly capped at 1R.
2. Mathematical Expectancy: The True Engine of Trading Longevity
Every quantitative trading model deployed at hedge funds or institutional desks is evaluated by its mathematical expectancy ($E$). Expectancy defines the average dollar amount or R-multiple you can expect to win or lose per trade over a large sample size of executions.
E = (Win Rate × Average Win) - (Loss Rate × Average Loss)
Let us translate this into normalized risk units ($R$), where 1R equals the predetermined dollar risk on a single trade (for instance, 1% of total account balance):
- System A (High Win Rate, Inverted R:R): 75% Win Rate, Average Win = 0.5R, Average Loss = 2.0R.
$E = (0.75 imes 0.5R) - (0.25 imes 2.0R) = 0.375R - 0.500R = -0.125R$.
Despite winning three out of every four trades, System A guarantees account bankruptcy over 500 trades because every trade has a negative expected value of -0.125R. - System B (Low Win Rate, Institutional 1:3 R:R): 38% Win Rate, Average Win = 3.0R, Average Loss = 1.0R.
$E = (0.38 imes 3.0R) - (0.62 imes 1.0R) = 1.14R - 0.62R = +0.52R$.
System B loses more than six out of every ten trades. Yet, for every trade executed, the trader collects an expected net return of +0.52R. Over 200 trades, System B generates a net yield of +104R.
When you understand this mathematical reality, the psychological urge to be "right" on every trade vanishes. Your primary responsibility as an operator shifts from predicting market direction to engineering trades with positive expected value and defending your stop loss with uncompromising discipline.
3. The Breakeven Win Rate Formula and Comparative Expectancy Table
To determine whether a specific risk-to-reward ratio is viable, you must calculate the minimum win rate required to prevent account decay. The breakeven win rate formula provides this exact threshold:
Breakeven Win Rate = 1 / (1 + Reward Multiple)
For a 1:1 setup, the required breakeven win rate is $1 / (1 + 1) = 50.0\%$. Once commissions, exchange fees, and bid-ask spread slippage are factored in, a 1:1 strategy actually demands a 53% to 55% win rate just to tread water. In contrast, look at how the required win rate collapses as you widen your structural reward targets:
| Risk to Reward Ratio | Breakeven Win Rate | Expected Return at 40% Win Rate (100 Trades) | Expected Return at 50% Win Rate (100 Trades) | Institutional Viability |
|---|---|---|---|---|
| 1:1.0 | 50.0% | -20.0 R (Net Loss) | 0.0 R (Breakeven) | Unviable after fees & slippage |
| 1:1.5 | 40.0% | 0.0 R (Breakeven) | +25.0 R | Marginal retail threshold |
| 1:2.0 | 33.3% | +20.0 R | +50.0 R | Acceptable for swing trading |
| 1:3.0 | 25.0% | +60.0 R | +100.0 R | Institutional Gold Standard |
| 1:4.0 | 20.0% | +100.0 R | +150.0 R | High-Conviction Liquidity Expansion |
| 1:5.0 | 16.7% | +140.0 R | +200.0 R | Macro Trend Following / HTF Expansions |
Study the 1:3 row carefully. At a 1:3 risk to reward ratio, you can be incorrect 70% of the time (a 30% win rate) and still book a solid profit of +20R over 100 trades. At a 40% win rate—achievable by simply following high-timeframe order flow and liquidity sweeps—you generate +60R of profit.
4. Why 90% of Retail Traders Fail: The Inverted Risk Trap
Statistical audits from European regulatory bodies (ESMA) and major retail brokerage platforms consistently reveal that between 74% and 89% of retail traders lose money. While psychology and lack of edge are frequently blamed, the primary mathematical culprit is the inverted risk trap.
The human brain is naturally risk-averse when confronted with profits, but risk-seeking when confronted with losses. When a retail trader watches an open trade move into \$300 of profit, panic sets in: they fear the market will reverse and snatch the profit away. They close the trade early for a meager 0.5R or 0.8R gain.
Conversely, when the market moves against them into a -\$500 deficit, the same trader enters emotional denial. They move their stop loss farther away, hoping for a rebound. In severe cases, they add to a losing position (martingale behavior). A trade intended to risk 1R ends up closing at a -3R or -5R loss.
This creates an inverted profile: taking micro-profits of 0.5R and swallowing massive losses of 3R. In this inverted regime, a trader must win 86% of their trades just to break even. A single bad trading session destroys three weeks of disciplined work.
Pozisyon Büyüklüğünüzü Kurumsal Hassasiyetle Hesaplayın
İşlemler arasında lot büyüklüğünüz dalgalanırsa 1:3+ R:R stratejisi çöker. Altın ve forexte sabit riskinizi korumak için lot büyüklüğünüzü belirleyin:
Open Free Position Size Calculator6. How Institutional Desks Engineer Asymmetric 1:3+ Trade Setups
Retail traders often believe that securing a 1:3 R:R trade requires targeting massive, unrealistic price moves. This is a complete misconception. Securing a 1:3+ ratio is not achieved by pushing your take profit to the moon; it is accomplished by tightening your invalidation point using structural precision.
Institutional desks deploy Smart Money Concepts (SMC) to minimize stop loss distances without getting prematurely stopped out. Here is the operational framework:
- Trade Only at Higher-Timeframe (HTF) Points of Interest: Wait for price to tap a 4-Hour or 1-Hour Order Block, Fair Value Gap (FVG), or sweep significant external liquidity pools. Never enter in the middle of a consolidation range.
- Wait for Lower-Timeframe (LTF) Market Structure Shifts: Once price taps the HTF zone, drill down to the 5-minute or 1-minute chart. Wait for a clear Break of Structure (BOS) or Change of Character (CHoCH) with displacement.
- Anchor Stops Behind the Invalidation Level: Position your stop loss precisely 1 to 2 ticks beyond the displacement candle swing high/low or behind the newly formed breaker block. If that level breaks, the setup idea is proven mathematically false.
- Target Opposing Liquidity Pools: Set your take profit at the opposing session high, equal highs (EQH), or unmitigated liquidity pools. Because your entry was refined on the 1-minute or 5-minute chart with an 8-tick stop, reaching the 1-hour opposing swing high yields 32 ticks—delivering an effortless 1:4.0 R:R.
As highlighted in our institutional confluence strategy guide, stacking structural order flow with session timing creates high-probability asymmetric entry conditions.
7. Target Management: Fixed Multiples vs Trailing Runners
Once in a winning position, how should an institutional trader manage the trade to extract maximum value while protecting accrued gains? Desk managers debate between two primary models:
Model A: The Strict Fixed Target (Set-and-Forget)
In this model, the trader defines entry, stop loss, and take profit at a strict 1:3.0 ratio. Once filled, the trader does not intervene. The position either hits the full +3R target or stops out at -1R.
Advantages: Eliminates emotional meddling, fear, and premature exits. Keeps backtested expectancy pure. Over 500 trades, fixed 1:3 execution produces reliable equity growth.
Model B: The 80/20 Runner Architecture
In volatile commodity markets like Gold (XAU/USD) or equity index futures (NQ/ES), market trends can stretch far beyond 1:3. Institutional strategists frequently implement an 80/20 scale-out model:
- Target 1 (1:2.5 to 1:3.0 R:R): Liquidate 75% to 80% of the position volume. This locks in +2.25R to +2.4R of realized profit.
- Stop Loss Adjustment: Move the stop loss on the remaining 20% to breakeven (entry price + spread). The trade is now mathematically risk-free.
- Target 2 (Runner): Trail the stop loss behind major lower-timeframe swing structural points (swing lows in an uptrend, swing highs in a downtrend) targeting major daily liquidity. Runners frequently achieve 1:6 to 1:10 returns, creating massive upside skew in your equity curve.
8. Live Case Study: Marcus Reid on Gold Futures (GC) 1:4.2 R:R Execution
To illustrate how asymmetric risk to reward functions during live market conditions, let us analyze an institutional setup executed by Marcus Reid on the Gold Futures contract (GCZ6) during the London-to-New York transition:
- Higher-Timeframe Context: Daily market structure is firmly bullish. The previous day's low was swept at \$2,642.50 during the London session, liquidating retail sell stops.
- Point of Interest: Price reacted off a 4-Hour Bullish Fair Value Gap situated between \$2,644.00 and \$2,648.00.
- Lower-Timeframe Confirmation: At 08:35 AM Eastern (New York Open), the 5-minute chart executed an aggressive bullish Market Structure Shift (MSS), printing a strong displacement candle that broke local swing highs at \$2,651.00.
- Execution Parameters:
- Entry: Limit order filled on the 5-minute Fair Value Gap retest at \$2,649.50.
- Stop Loss: Placed at \$2,645.50 (4.0 points / 40 ticks risk, protected below the displacement swing low).
- Risk Capital: \$2,000 (representing exactly 1.0% on a \$200,000 institutional account, translating to 5 GC contracts with \$400 risk per contract).
- Take Profit Target: Anchored at the Asian Session High liquidity pool at \$2,666.30 (16.8 points / 168 ticks gain).
- The Mathematical Result: Risk was \$4.00. Target gain was \$16.80. The realized risk to reward ratio was exactly 1:4.2 R:R. Upon target fill at 10:15 AM, the trade deposited a net gain of +\$8,400 (+4.2R) into the trading account.
Notice that even if the previous three consecutive trades had been stopped out at -1R each (-\$6,000 total loss), this single 1:4.2R trade erased all three prior losses and left the account up +\$2,400 net. That is the mathematical armor of asymmetric risk management.
Quantitative Risk-to-Reward Pine Script v5 Calculator
Institutional traders automate risk assessment before executing orders. Below is an efficient Pine Script v5 mathematical helper designed to display active R:R brackets and dynamic position sizing directly on TradingView charts:
9. Prop Firm Risk Protocol: Drawdown Buffers and Daily Loss Caps
In modern prop trading environments (such as FTMO, FundedNext, or Topstep), managing your risk-to-reward ratio is a survival requirement. Prop firms do not fail traders because of bad chart analysis; they fail traders who breach strict daily drawdown rules (typically 4% to 5%) or maximum trailing drawdowns (8% to 10%).
As documented in our trailing vs static drawdown comparative study, prop evaluation algorithms track equity high-water marks in real time. If you trade with an inverted 1:1 or 1:0.5 R:R, a cluster of four losses breaches your maximum daily threshold and terminates your funded account.
Institutional prop traders execute a specialized risk-scaling rule:
- Base Risk per Setup: Maximum 0.50% of account balance during evaluation phases, and 0.25% to 0.50% once funded.
- Loss Cluster Defense: If you incur 2 consecutive losses in a single session (-1.0% total), trading is halted immediately for the day. You never approach the 5.0% daily violation ceiling.
- Asymmetric Target Execution: Because each winner returns 1:3.0 or greater (+1.5% to +2.0% net on 0.5% risk), achieving an 8% evaluation profit target requires only 4 or 5 clean wins over an entire month.
10. The 5-Step R:R Pre-Trade Execution Checklist
Before submitting any market or limit order to your broker, run through this non-negotiable 5-step validation sequence:
- Structural Invalidation Check: Is your stop loss anchored behind a verified swing high/low, Fair Value Gap, or breaker block? If your stop is placed arbitrarily to fit an arbitrary dollar amount, the trade is rejected.
- Objective Liquidity Target: Is your take profit anchored at a tangible resting liquidity pool (Equal Highs, Previous Day High/Low, or unmitigated imbalance)? If your target sits in "empty air" simply to force a 1:3 ratio, the trade is invalid.
- Calculated R:R Ratio $\ge$ 1:2.5: Does the mathematical distance between entry and target equal at least 2.5 times the stop distance? If the calculated R:R is below 1:2.5, pass on the trade. Better setups appear daily.
- Uniform Position Sizing Applied: Have you calculated your exact contract or lot size based on your fixed 1% risk limit? Verify the lot size using our forex & futures risk calculator.
- No High-Impact News Window: Ensure your entry does not sit within 15 minutes of major FOMC, CPI, or NFP releases, where slippage can distort your stop loss distance beyond pre-calculated limits.
The Afolks Digital Multi-Platform Ecosystem
Quantitative trading systems require comprehensive institutional infrastructure across education, software automation, and real-time execution tools. The Afolks Digital network delivers end-to-end support across four specialized platforms:
- Enterprise Software & Quantitative Architecture: Discover enterprise-grade digital infrastructure and quantitative systems at our corporate headquarters on Afolks Digital Corporate.
- Student Mentorship & Trader Education: Learn systematic Smart Money Concepts, institutional order flow, and risk modeling through masterclasses at Afolks Digital Learn.
- Trading Academy & Real-Time Analytics: Access live algorithmic signals, TradingView chart indicators, and real-time trading calculators directly on Afolks Digital Trading Academy.
- Free Productivity & Conversion Utilities: Explore our expanding suite of web-based conversion tools and financial utilities hosted on Afolks Digital Tools.