

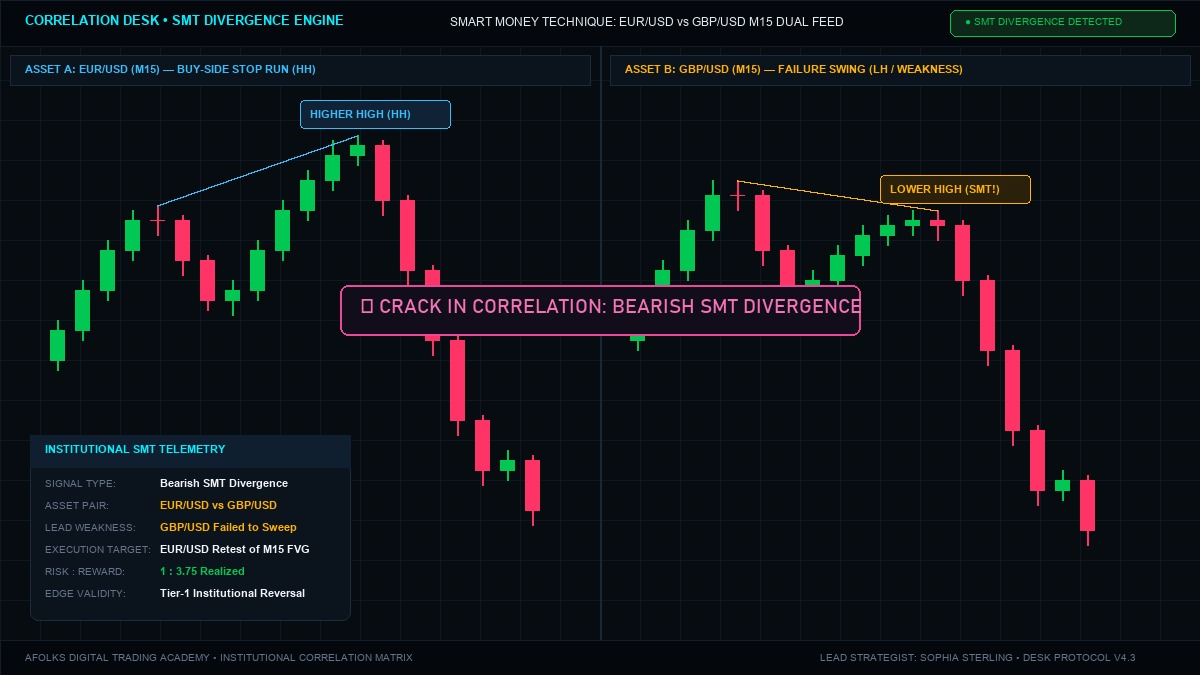
SMT Divergence (Smart Money Technique) occurs when two highly correlated assets fail to confirm each other at key swing highs or swing lows. For instance, when EUR/USD prints a higher high during a session liquidity sweep, but GBP/USD fails and forms a lower high, this "crack in correlation" reveals that the move is an institutional stop hunt rather than genuine buying. Smart money is actively distributing. Traders exploit this non-confirmation to enter high-probability reversal trades targeting opposite liquidity pools.
- 1. What is SMT Divergence? The Institutional Logic Behind Correlated Assets
- 2. SMT Divergence vs Classical RSI Divergence: Why Oscillators Fail
- 3. Bearish SMT Divergence: Anatomy of an Institutional Trap
- 4. Bullish SMT Divergence: Spotting Institutional Accumulation
- 5. The Institutional Asset Correlation Matrix: Forex, Futures & Crypto
- 6. The 4-Step SMT Execution Model: FVG, Breaker & Killzone Alignment
- 7. Risk Management and Mathematical Expectancy (1:3.5+ Target Blueprint)
- 8. Live Case Study: EUR/USD vs GBP/USD London Open SMT Reversal
- 9. 5 Fatal SMT Divergence Mistakes to Eliminate
- 10. Frequently Asked Questions (PAA)
1. What is SMT Divergence? The Institutional Logic Behind Correlated Assets
In modern financial markets, major asset classes do not trade in isolation. Tier-one institutional algorithms execute simultaneous cross-market order flow. For example, when global central banks shift monetary policy, the US Dollar Index (DXY) moves inversely against the European basket: EUR/USD and GBP/USD. Similarly, equity benchmark futures—the E-mini S&P 500 (ES) and Nasdaq 100 (NQ)—generally track identical macroeconomic liquidity conditions.
Because these asset pairs share nearly identical fundamental drivers, their price charts should logically mirror each other. When EUR/USD establishes a new swing high during a session expansion, GBP/USD should print a corresponding swing high. When ES plunges to take out overnight lows, NQ should break its own overnight lows.
However, during critical turning points, this perfect correlation breaks down. One asset surges past a key swing high to take out buy-side liquidity, while its sister asset hesitates, stalling below its previous swing high.
In ICT (Inner Circle Trader) and Smart Money Concepts, this divergence is known as the Smart Money Tool (SMT) Divergence. It is not an accident. It is a direct footprint of institutional accumulation or distribution.
When market makers want to engineer a massive reversal, they do not have enough liquidity to buy or sell their full positions at market price without slippage. They push one specific asset into a liquidity pool (running retail stops) while quietly building opposing positions in the sister asset. The asset that fails to make the new extreme reveals the true directional intent of smart money.
2. SMT Divergence vs Classical RSI Divergence: Why Oscillators Fail
Retail technical traders spend years attempting to trade divergences using mathematical indicators like the Relative Strength Index (RSI), MACD, or Stochastic oscillators, as analyzed in our Ultimate RSI Indicator Guide. While oscillator divergences can alert you to waning momentum, they suffer from a fatal flaw: mathematical lag.
An RSI indicator takes the closing prices of the last 14 candles, applies an exponential smoothing calculation, and projects a line bounded between 0 and 100. In strong trending institutional markets, the RSI frequently remains in "overbought" or "oversold" territory for dozens of candles, generating false reversal signals that blow retail trading accounts.
| Evaluation Parameter | Classical RSI Divergence | Institutional SMT Divergence |
|---|---|---|
| Data Source | Lagged mathematical formula of past closing prices | Pure intermarket price action across two live assets |
| Lag Factor | High (requires multiple candles to smooth values) | Zero (real-time tick by tick non-confirmation) |
| Institutional Backing | None (institutions do not trade off retail RSI lines) | Direct footprint of cross-asset capital allocation |
| False Signal Rate | Very High during strong trending sessions | Extremely Low when aligned with Higher-Timeframe POIs |
| Context Dependency | Often used in isolation by retail traders | Strictly paired with Liquidity Sweeps and Killzones |
SMT Divergence does not depend on an indicator formula. It compares pure order flow between two actual markets. When you observe SMT, you are seeing one market tell the truth while the other creates a liquidity trap.
3. Bearish SMT Divergence: Anatomy of an Institutional Trap
A Bearish SMT Divergence occurs at market tops, session highs, or major resistance zones. It signals that an upward move is exhausted and smart money is preparing to drive prices lower.
Here is the mechanical sequence:
- Synchronized Run: Two correlated assets (e.g., EUR/USD and GBP/USD) both establish an initial swing high during the session.
- The Breakout Push: News releases or opening session volatility drives both assets upward toward their respective swing highs.
-
The Crack in Correlation:
- Asset A (EUR/USD): Rallies aggressively, clearing above the previous swing high to print a clean Higher High (HH). Retail breakout traders rush in to buy the breakout. Retail stop losses resting above the high are triggered.
- Asset B (GBP/USD): Struggles to push higher. It fails to break its previous swing high, printing a distinct Lower High (LH).
- The Institutional Meaning: If genuine institutional capital were driving this bullish expansion, both pairs would break out forcefully. The fact that GBP/USD failed to make a higher high proves that institutions are refusing to buy pounds at these prices. They are using the EUR/USD push purely to engineer exit liquidity for their long positions and accumulate short inventory.
- The Execution Consequence: Asset B (GBP/USD) has revealed genuine weakness. Once Asset A (EUR/USD) completes its liquidity grab and displaces downward, both assets collapse in tandem.
Asset A (Leader/Trap) → High (H) → Higher High (HH) [Liquidity Purged]
Asset B (Weakness/Truth) → High (H) → Lower High (LH) [Failure Swing]
Result: Bearish SMT Confirmed → Target Sell-Side Liquidity (SSL)
Calculate Position Size & Stop Distance for Correlated Trades
Trading SMT divergence requires exact risk sizing. Because your stop loss sits tightly above the divergence swing, precise lot sizing is essential to pass prop firm evaluations. Calculate your exact lot sizes in seconds:
Launch Free Position Size Calculator →4. Bullish SMT Divergence: Spotting Institutional Accumulation
A Bullish SMT Divergence forms at market bottoms, session lows, or key higher-timeframe demand pools. It reveals institutional accumulation before a sharp upward rally takes place.
The sequence unfolds as follows:
- Asset A: Declines sharply below an established swing low, printing a Lower Low (LL). This move triggers sell stop orders from retail long positions and attracts breakout short sellers.
- Asset B: Declines toward its previous swing low but fails to break it. It prints a clear Higher Low (HL), refusing to print a new extreme.
This non-confirmation signals that smart money is absorbing all available sell orders in Asset B without letting price slip lower. Asset B is displaying underlying institutional strength. When Asset A finishes sweeping its sell stops, price aggressively displaces to the upside across both markets.
5. The Institutional Asset Correlation Matrix: Forex, Futures & Crypto
To execute SMT setups successfully, you must track pairs that exhibit strong, persistent correlation. Applying SMT divergence to uncorrelated assets will produce random results.
On our prop desk, we focus on three core asset clusters:
1. Foreign Exchange (Forex) Matrix
- EUR/USD vs GBP/USD: The most popular and liquid forex SMT combination. Both pairs track general US dollar sentiment. When EUR/USD sweeps highs while GBP/USD prints a lower high, look for short setups across the European complex.
- EUR/USD vs US Dollar Index (DXY): An inverse correlation model. EUR/USD accounts for 57.6% of the DXY weighting. Under normal conditions, when EUR/USD makes a Higher High, DXY must make a Lower Low. If EUR/USD makes a Higher High, but DXY fails to make a Lower Low (printing a Higher Low instead), you have an inverse SMT divergence confirming heavy institutional dollar buying.
2. US Equity Index Futures Matrix
- ES (S&P 500) vs NQ (Nasdaq 100): The premier equity futures pairing. Because tech stocks dominate NQ while ES represents the broader corporate market, institutional sector rotation frequently shows up as SMT divergence at the 09:30 AM New York cash open.
- ES vs YM (Dow Jones Industrial Average): Useful during heavy economic releases (such as FOMC rate decisions or Non-Farm Payrolls) when industrial blue chips diverge from financial and tech heavyweights.
3. Digital Assets (Crypto) Matrix
- BTC/USD vs ETH/USD: Bitcoin and Ethereum generally move in tandem during weekly macro swings. When Bitcoin surges to set a fresh weekly high while Ethereum prints a lower high, smart money is rotating out of altcoins, signaling an imminent corrective pullback across the entire crypto ecosystem.
6. The 4-Step SMT Execution Model: FVG, Breaker & Killzone Alignment
Never enter a trade purely because you observe an SMT divergence line on your chart. SMT is a directional confirmation tool, not an independent execution trigger.
To build a high-probability trade setup, integrate SMT within our systematic four-step institutional workflow:
Step 1: Identify Higher-Timeframe Point of Interest (HTF POI)
Using our Multi-Timeframe SMC Roadmap, establish whether price is currently trading into a 4-hour (H4) or Daily Point of Interest. Look for an untapped Fair Value Gap, a key liquidity pool, or a higher-timeframe order block. SMT divergence occurring in the middle of nowhere has zero predictive value. SMT occurring inside a HTF POI represents an A+ setup.
Step 2: Filter by Session Killzone
Execute only during high-volume institutional windows:
- London Open Killzone: 07:00 to 10:00 UTC (02:00 to 05:00 AM NY time). Exceptional for EUR/USD vs GBP/USD SMT sweeps.
- New York Open Killzone: 13:00 to 16:00 UTC (08:00 to 11:00 AM NY time). Best for ES vs NQ divergence setups.
- London Close: 15:00 to 17:00 UTC (10:00 AM to 12:00 PM NY time) for counter-trend intraday profit-taking reversals.
Step 3: Confirm Lower-Timeframe Market Structure Shift (MSS)
Once SMT divergence forms between your correlated assets, zoom into the 5-minute (M5) or 1-minute (M1) chart. Wait for price to aggressively displace through the recent swing low (for a bearish setup) or swing high (for a bullish setup). This displacement confirms that institutional algorithms have officially shifted the internal order flow.
Step 4: Execute on Confluence Retest
Enter on the retracement into the newly formed imbalance:
- An entry into a 1-minute or 5-minute Fair Value Gap (FVG).
- An entry on the retest of a Breaker Block or an Inversion FVG.
- Confluence with the 50% Consequent Encroachment (CE) level of the breaker.
7. Risk Management and Mathematical Expectancy (1:3.5+ Target Blueprint)
The primary operational advantage of trading SMT divergence is the ability to place tight, mathematically protected stop losses. Because SMT identifies the exact manipulation high or low of a session, your structural invalidation level is unambiguous.
Stop Loss Placement Rules
- Which Asset Do You Trade? Always trade the asset that showed clear structural confirmation. In a bearish SMT setup, you can either short the weaker asset (Asset B) for maximum downside velocity, or short the asset that swept liquidity (Asset A) because its high is established and protected.
- The Buffer Rule: Place your stop loss 2 to 3 pips beyond the extreme of the sweep candle on Asset A, or above the lower high on Asset B. If price exceeds this level, the correlation thesis is invalidated. Exit immediately.
Mathematical Edge Analysis
When trading funded prop accounts, managing risk is the only factor separating profitable traders from failed accounts. Examine the long-term mathematical distribution:
Total Trades: 100 | Risk per Trade: 1.0% ($1,000 on $100K Account)
Win Rate: 42% (42 Wins, 58 Losses)
Average Winning Trade: 1:3.5 R:R ($3,500)
Average Losing Trade: 1.0 R ($1,000)
Gross Profit: 42 * $3,500 = $147,000
Gross Loss: 58 * $1,000 = $58,000
Net Realized Profit: +$89,000 (+89.0% ROI)
Even if you lose more than half your trades (58 out of 100), the asymmetrical 1:3.5 payout ratio generated by SMT divergence entries yields substantial compounding returns.
8. Live Case Study: EUR/USD vs GBP/USD London Open SMT Reversal
To understand how this strategy operates in live market conditions, let us dissect an institutional trade executed by Sophia Sterling during a London trading session:
- Context: The Daily chart for EUR/USD had rallied into a 4-hour Bearish Fair Value Gap. Meanwhile, the US Dollar Index (DXY) was resting on key daily support.
- 07:45 UTC (Pre-London Open): Both EUR/USD and GBP/USD began drifting upward toward their respective Asian session highs.
-
08:15 UTC (The SMT Crack):
- EUR/USD spiked aggressively through its Asian high (1.08750), reaching 1.08860 (Higher High by +11 pips). Buy stops were purged.
- GBP/USD rallied toward its Asian high (1.27400) but stalled at 1.27360, printing a clean Lower High (SMT Divergence).
- 08:30 UTC (Confirmation): A 5-minute Market Structure Shift occurred on EUR/USD, displacing downward by 28 pips and leaving an M5 Fair Value Gap between 1.08720 and 1.08780.
-
Trade Execution:
- Entry: Short on EUR/USD at 1.08750 (50% Consequent Encroachment of the M5 FVG)
- Stop Loss: 1.08885 (13.5 pips, 2.5 pips above the sweep high)
- Take Profit: 1.08240 (Previous day low / Sell-Side Liquidity)
- Risk-to-Reward: 1:3.77 realized
- Outcome: Price tapped 1.08750 without exceeding 1.08770, then dropped impulsively. Over the next 90 minutes, EUR/USD plunged 51 pips to hit the full profit target for a +$3,770 gain on a standard 1% risk allocation.
9. 5 Fatal SMT Divergence Mistakes to Eliminate
Avoid these critical pitfalls to maintain your edge when trading correlated smart money divergence:
- Trading SMT Without a Timeframe Anchor: Never trade an SMT divergence that forms solely on a 1-minute chart without higher-timeframe context. Always ensure your setup aligns with a 15-minute, 1-hour, or 4-hour Point of Interest.
- Ignoring Major High-Impact News: Avoid initiating new SMT positions within 5 minutes before CPI, FOMC, or NFP releases. Spread widening and slippage during news spikes can stop you out before the directional trend forms.
- Failing to Wait for Market Structure Shift (MSS): Observing an SMT divergence does not mean you immediately hit market buy or sell. Wait for displacement and a clear market structure shift to confirm that institutions have engaged.
- Comparing Uncorrelated Pairs: Attempting to trade SMT divergence between EUR/USD and AUD/USD during European morning hours can lead to false signals because the Australian Dollar is heavily driven by Asian trade balances and commodity prices rather than European bond yields.
- Widening Your Stop Loss: If price pushes through the sweep high of your SMT setup, your thesis is wrong. Never widen your stop loss or add to a losing position. Take the calculated 1R loss and move on to the next opportunity.
Explore the Afolks Digital Trading Ecosystem
Empower your financial journey with our four dedicated institutional platforms:
- Master institutional concepts step-by-step with guided masterclasses on our Student Learning Platform.
- Access real-time quantitative trade setups and live alerts via Afolks Digital Trading Academy.
- Leverage our full suite of productivity and analysis tools on the Free Online Tools Platform.
- Discover custom algorithmic software and enterprise solutions on our Corporate Agency Website.