
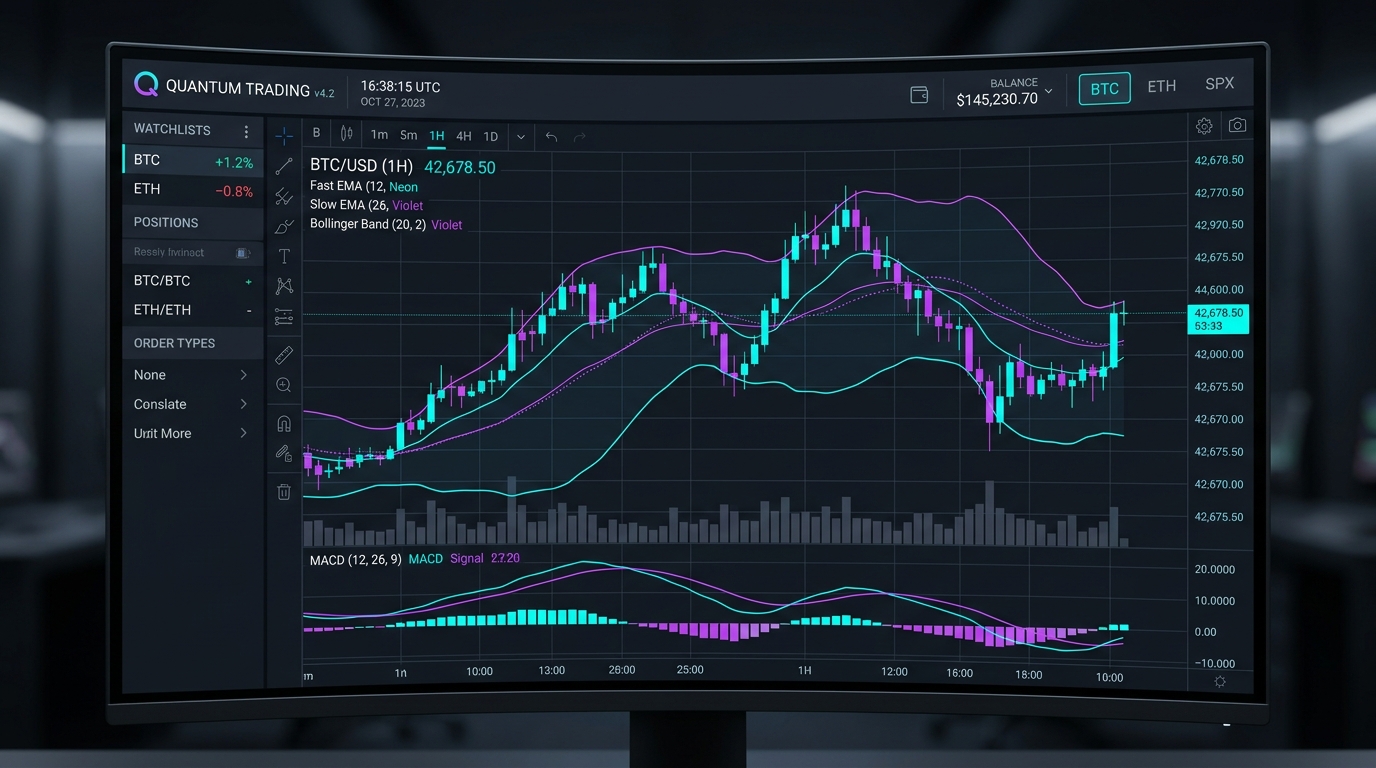
Indicators support decisions — they do not replace skill
Technical indicators process historical price, volume, or open interest data to highlight market trends and momentum. However, no indicator predicts the future. Indicators act as decision-support filters to confirm price action setups rather than standalone trade signals.
Trend indicators: Identifying directional bias
Moving Averages (such as the 50-period and 200-period EMA) smooth out short-term price fluctuations to reveal macro market trends. When price trades above the 200 EMA, institutional bias is bullish; when below, bias is bearish.
Momentum and volatility tools
- Moving Average Convergence Divergence (MACD): Measures changes in trend momentum and signal line crossovers.
- Bollinger Bands: Measures market volatility and identifies potential mean-reversion extremes when price touches outer bands.
- Volume Profile / Relative Strength Index (RSI): Tracks underlying buyer vs seller strength and volume node clusters.
Avoid chart clutter and indicator conflict
Adding five or six lagging indicators to your chart creates conflicting signals and analysis paralysis. Keep your chart clean by using a maximum of one trend indicator and one momentum oscillator alongside price action.
Where Afolks Digital Fits
Afolks Digital provides precision position-sizing tools, automated trade signal broadcasts, and risk management calculators for retail Forex, Stock & Crypto traders. It supports disciplined risk management by calculating exact lot sizes before executing trades live.
Frequently Asked Questions
What is the single best trading indicator?
There is no single best indicator. Moving Averages work best in trending markets, while oscillators like RSI work better in ranging markets.
Are technical indicators lagging or leading?
Most indicators are lagging because they are calculated using historical price data. Price action and order flow are leading indicators.
How many indicators should I use on my chart?
We recommend using no more than 2 indicators (e.g., 200 EMA + RSI) to keep charts clean and prevent decision paralysis.